Lets take a light bubbly kubernetes project like arkade retro gaming and ramp up the fun by adding monitoring! Bleck. Seriously though, I’d like to learn more about monitoring a kubernetes cluster so lets get started. Today (erm this week) I’ll build that into my home cluster.
Setup
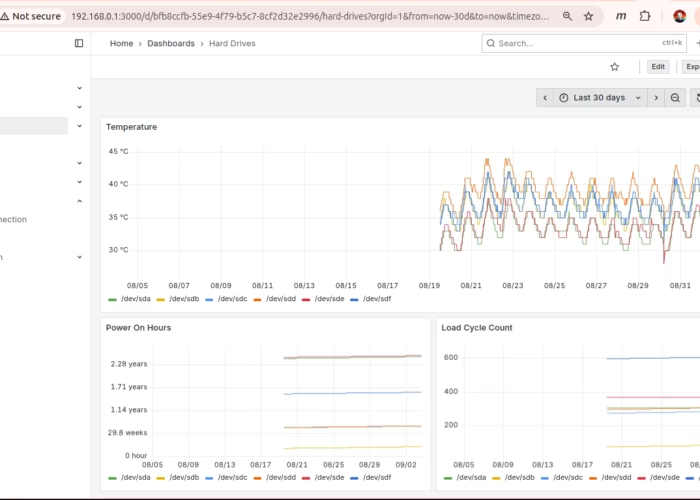
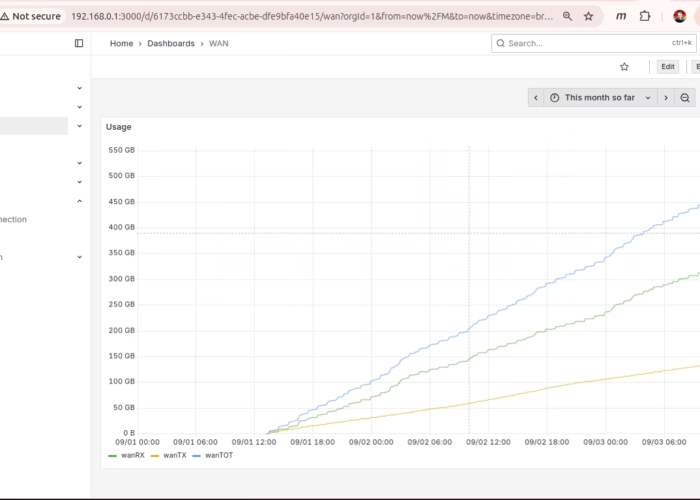
I recently setup the grafana/prometheus combination to monitor my main server. The server runs pretty idle, and never really gets overloaded. I do want to monitor drive temps on the server RAID. I also want to monitor network usage of the WAN NIC just to compare with the usage report from my ISP.
To get the network monitor, I setup a custom vnstat -> telegraf -> prometheus chain which was sort of interesting (but *really* not required for my cluster – so skip over if you want). The kubernetes content you crave continues below…
vnstat
$ sudo apt install vnstat
$ systemctl enable vnstat
$ systemctl start vnstat
I played with vnstat commands for a while to reduce the number of interfaces it was tracking:
$ sudo vnstat --remove --iface gar0 --force
$ sudo vnstat --add --iface wan
$ sudo vnstat --add --iface lan
...
$ vnstat wan -m

 wan  /  monthly

        month        rx      |     tx      |    total    |   avg. rate
     ------------------------+-------------+-------------+---------------
       2025-08     99.15 GiB |   23.86 GiB |  123.01 GiB |  394.52 kbit/s
       2025-09    394.20 GiB |  169.98 GiB |  564.18 GiB |   21.31 Mbit/s
     ------------------------+-------------+-------------+---------------
     estimated      4.39 TiB |    1.89 TiB |    6.28 TiB |
Let that run for a while and soon you can dump traffic stats for the various NICs in the linux box. Side note my linux server is my router so I’ve got my interface adapters renamed ‘wan’, ‘lan’, ‘wifi’ etc. depending on what they are connected to. ‘wan’ is external traffic to the modem. ‘lan’ is all internal traffic (lan is a bridge). ‘wifi’ goes off to my wireless access point (wifi lives in the lan bridge).
telegraf
Now setup telegraf to scrape the vnstat reports and feed them to prometheus.
$ sudo apt install telegraf
$ cat /etc/telegraf/telegraf.d/vnstat.conf
[[inputs.exec]]
  commands = ["/usr/local/bin/vnstat-telegraf.sh"]
  timeout = "5s"
  data_format = "influx"
$ cat /usr/local/bin/vnstat-telegraf.sh
#!/bin/bash
for IFACE in wan lan wifi fam off bond0
do
   vnstat --json | jq -r --arg iface "$IFACE" '
     .interfaces[] | select(.name==$iface) |
     .traffic.total as $total |
     "vnstat,interface=\($iface) rx_bytes=\($total.rx),tx_bytes=\($total.tx)"
   '
done
$ sudo systemctl enable telegraf
$ sudo systemctl start telegraf
then check the config with a quick curl:
$ curl --silent localhost:9273/metrics | grep wan
vnstat_rx_bytes{host="www.hobosuit.com",interface="wan"} 5.34410207039e+11
vnstat_tx_bytes{host="www.hobosuit.com",interface="wan"} 2.10284865396e+11
prometheus
Now install prometheus and hookup telegraf:
$ sudo apt install prometheus
$ tail  /etc/prometheus/prometheus.yml

  - job_name: node
    # If prometheus-node-exporter is installed, grab stats about the local
    # machine by default.
    static_configs:
      - targets: ['localhost:9100']

  - job_name: 'telegraf-vnstat'
    static_configs:
      - targets: ['localhost:9273']
$ sudo systemctl restart prometheus
The prometheus is configured with the node exporter which includes the drive temp data I’m looking for and I’ve added the telegraf-nvstat config to put out the network usage stats. Check the node exporter with curl like this:
curl --silent localhost:9100/metrics | grep smartmon_temperature_celsius_raw
# HELP smartmon_temperature_celsius_raw_value SMART metric temperature_celsius_raw_value
# TYPE smartmon_temperature_celsius_raw_value gauge
smartmon_temperature_celsius_raw_value{disk="/dev/sda",smart_id="194",type="sat"} 35
smartmon_temperature_celsius_raw_value{disk="/dev/sdb",smart_id="194",type="sat"} 40
smartmon_temperature_celsius_raw_value{disk="/dev/sdc",smart_id="194",type="sat"} 41
smartmon_temperature_celsius_raw_value{disk="/dev/sdd",smart_id="194",type="sat"} 42
smartmon_temperature_celsius_raw_value{disk="/dev/sde",smart_id="194",type="sat"} 36
smartmon_temperature_celsius_raw_value{disk="/dev/sdf",smart_id="194",type="sat"} 40
Grafana
I setup grafana using docker-compose :
$ cat docker-compose.yaml
version: '3.8'

services:
  influxdb:
    image: influxdb:latest
    container_name: influxdb
    ports:
      - "8086:8086"
    volumes:
      - /grafana/influxdb-storage:/var/lib/influxdb2
    environment:
      - DOCKER_INFLUXDB_INIT_MODE=setup
      - DOCKER_INFLUXDB_INIT_USERNAME=admin
      - DOCKER_INFLUXDB_INIT_PASSWORD=thatsmypurse
      - DOCKER_INFLUXDB_INIT_ORG=my_org
      - DOCKER_INFLUXDB_INIT_BUCKET=my_bucket
      - DOCKER_INFLUXDB_INIT_ADMIN_TOKEN=idontknowyou

  grafana:
    image: grafana/grafana:latest
    container_name: grafana
    ports:
      - "3000:3000"
    volumes:
      - /grafana/grafana-storage:/var/lib/grafana
    environment:
      - GF_SECURITY_ADMIN_USER=thatsmypurse
      - GF_SECURITY_ADMIN_PASSWORD=idontknowyou
    depends_on:
      - influxdb

networks:
  default:
    driver: bridge
    driver_opts:
      com.docker.network.bridge.name: br-grafana
    ipam:
      config:
        - subnet: 172.27.0.0/24
Set a DataSource
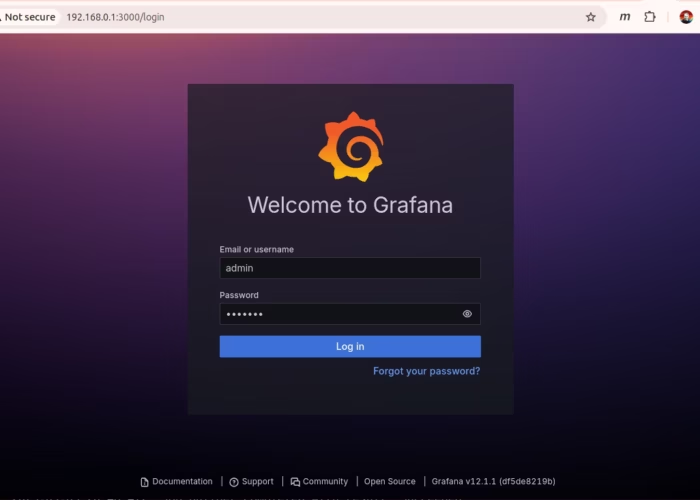
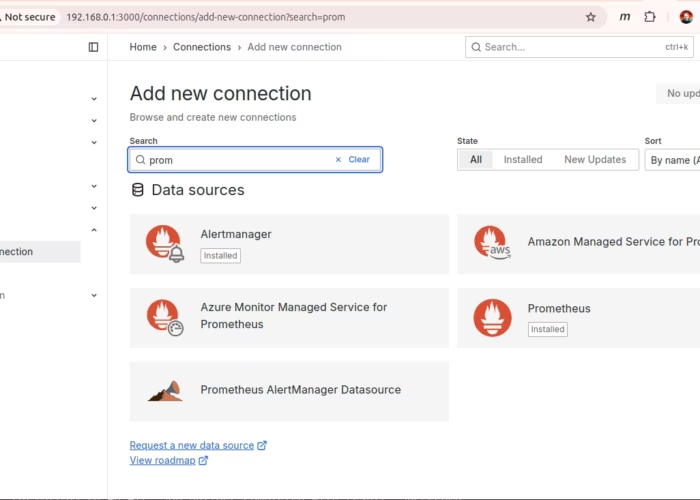
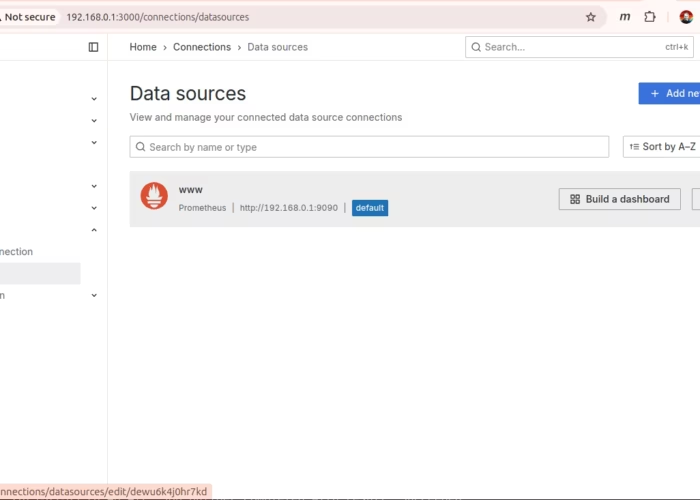
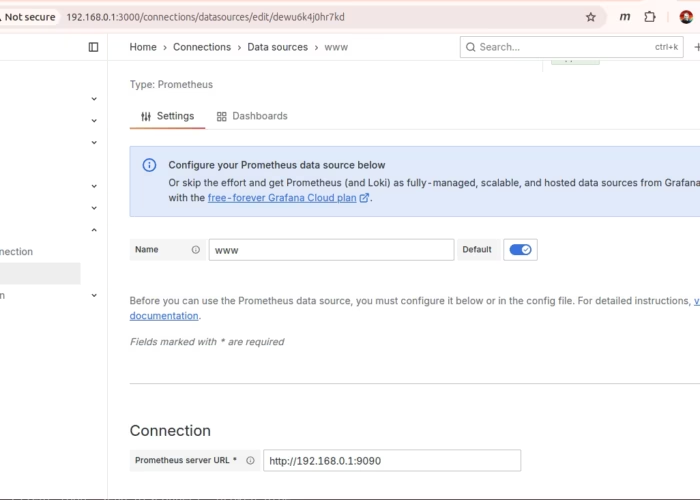
Finally, I can log in to grafana, setup a datasource and build some dashboards
Wait What?
I can’t build all that that nonsense every time I want to setup a node in a kubernetes cluster. Plus I don’t really need the wan usage stuff. Luckily ‘there’s a helm chart for that’. prometheus-community/kube-prometheus-stack puts the prometheus node exporter on each node (as a daemonset), and takes care of starting grafana with lots of nice preconfigured dashboards.
Dump the values.yaml
It’s a big complicated chart, so I found it helpful to dump the values.yaml file to study.
helm repo add prometheus-community https://prometheus-community.github.io/helm-charts
helm repo update
helm show values prometheus-community/kube-prometheus-stack > prom_values.yaml
Ultimately I came up with this script to install the chart into the mon namespace:
#!/bin/bash

. ./functions.sh

NAMESPACE=mon

info "Setup prometheus community helm repo"
helm repo add prometheus-community https://prometheus-community.github.io/helm-charts
helm repo update

info "Install prometheus-community chart into '$NAMESPACE' namespace"
helm upgrade --install prom prometheus-community/kube-prometheus-stack \
  --namespace $NAMESPACE \
  --create-namespace \
  --set grafana.adminUser=${GRAFANA_ADMIN} \
  --set grafana.adminPassword=${GRAFANA_PASSWORD} \
  --set grafana.persistence.type=pvc \
  --set grafana.persistence.enabled=true \
  --set grafana.persistence.storageClass=longhorn \
  --set "grafana.persistence.accessModes={ReadWriteMany}" \
  --set grafana.persistence.size=8Gi \
  --set grafana.resources.requests.memory=512Mi \
  --set prometheus.prometheusSpec.storageSpec.volumeClaimTemplate.spec.storageClassName=longhorn \
  --set "prometheus.prometheusSpec.storageSpec.volumeClaimTemplate.spec.accessModes={ReadWriteMany}" \
  --set prometheus.prometheusSpec.storageSpec.volumeClaimTemplate.spec.resources.requests.storage=4Gi \
  --set prometheus.prometheusSpec.retention=14d \
  --set prometheus.prometheusSpec.retentionSize=8GiB \
  --set prometheus.prometheusSpec.resources.requests.memory=2Gi

info "Wait for pods to come up in '$NAMESPACE' namespace"
pod_wait $NAMESPACE

info "Setup cert-manager for the grafana server"
kubectl apply -f prom_Certificate.yaml

info "Setup Traefik ingress route for grafana"
kubectl apply -f prom_IngressRoute.yaml

info "Wait for https://grafana to be available"
# grafana redirects to the login screen so a status code of 302 means it's ready
https_wait https://grafana/login '200|302'
I added persistence using longhorn volumes and setup my usual self-signed certificate to secure the traefik IngressRoute to the grafana UI. Here’s the other bits and pieces of yaml:
 cat prom_Certificate.yaml
apiVersion: cert-manager.io/v1
kind: Certificate
metadata:
  name: prom-grafana
  namespace: mon
spec:
  secretName: prom-grafana-cert-secret  # <===  Name of secret where the generated certificate will be stored.
  dnsNames:
    - "grafana"
  issuerRef:
    name: hobo-intermediate-ca1-issuer
    kind: ClusterIssuer

$ cat prom_IngressRoute.yaml
apiVersion: traefik.io/v1alpha1
kind: IngressRoute
metadata:
  name: grafana
  namespace: mon
  annotations:
    cert-manager.io/cluster-issuer: hobo-intermediate-ca1-issuer
    cert-manager.io/common-name: grafana
spec:
  entryPoints:
    - websecure
  routes:
    - kind: Rule
      match: Host(`grafana`)
      priority: 10
      services:
        - name: prom-grafana
          port: 80
  tls:
    secretName: prom-grafana-cert-secret
‘Monitoring’ ain’t easy
Plus/minus some trial and error I adjusted my cluster setup scripts to bring up the usual pieces plus this new monitoring chunk (prom.sh) is the new bit:
$ cat setup.sh
#!/bin/bash

. ./functions.sh
./cert-manager.sh
./argocd.sh

kubectl create ns games
./longhorn.sh

./prom.sh
… and then one of the nodes went catatonic – he’s dead Jim.
Monitoring is Expensive
No shock there there’s no free lunch with cluster monitoring. At the very least, you have to dedicate some hardware. In this case, my little cluster just couldn’t handle the memory requirements of grafana / prometheus. The memory foot-print in this cluster is 4GB in the control plane and 2GB in each node. I fixed it by digging out a pi5 8GB that I just bought and adding it as a node – so with the single board computer and accessories, monitoring will cost about $150.
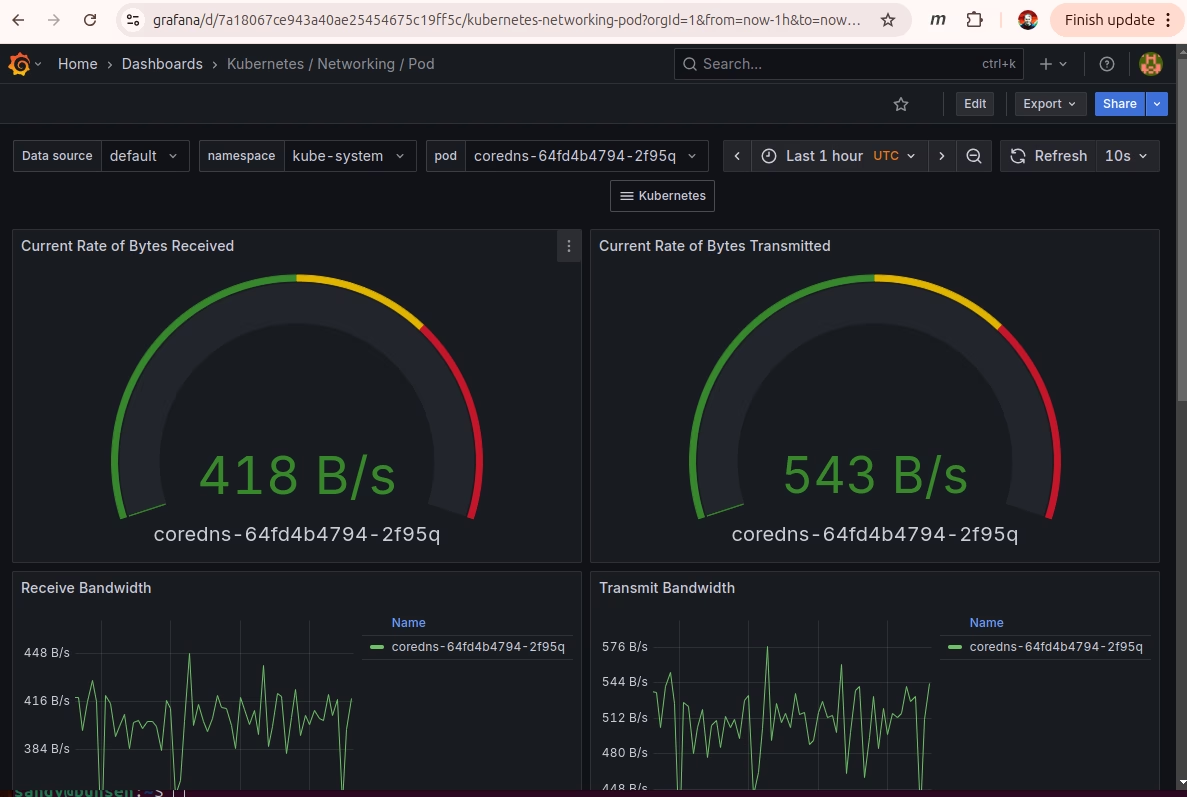
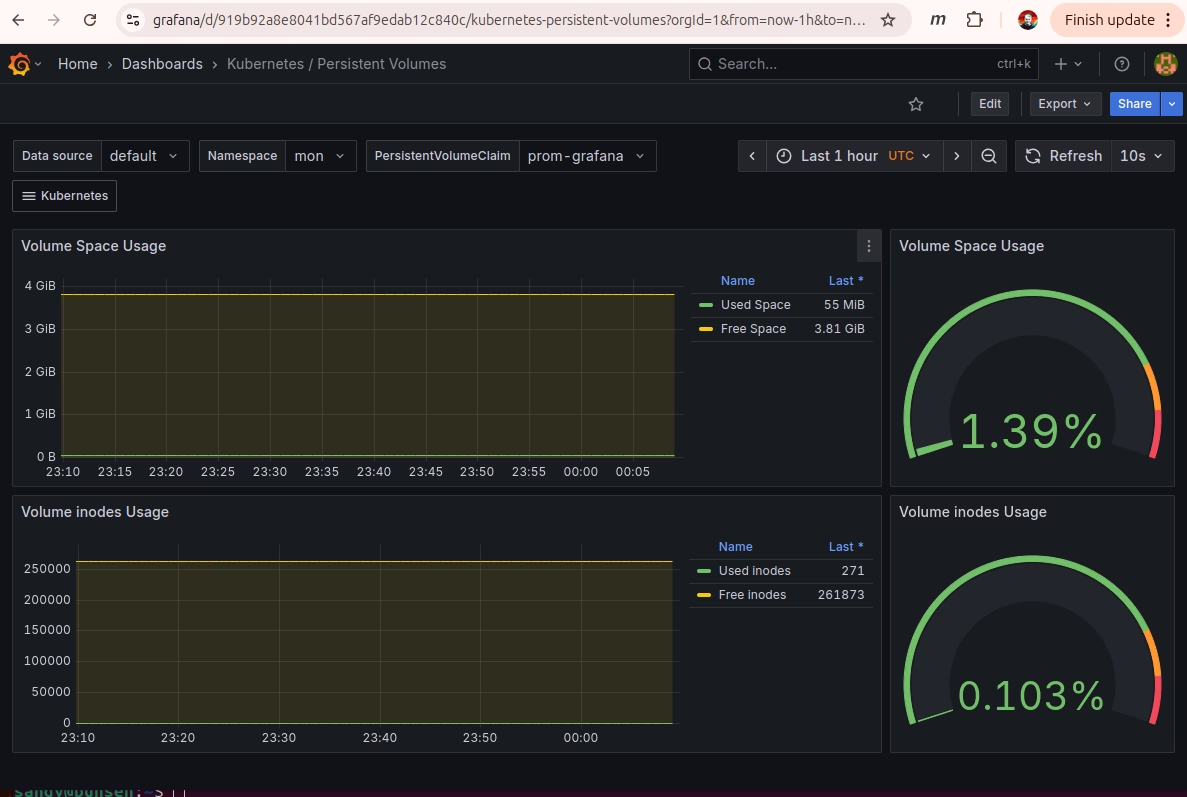
Finally Cluster Monitoring
Pretty. When it’s not crashing my main workloads. This gives me a start on learning to love monitoring and maybe even alerting.
A late add to the setup was to add a model label on each node. The Pi5 computers have more RAM – so I set affinity for the larger deployments to make things run smoother. The updated helm install command looked like this:
helm upgrade --install prom prometheus-community/kube-prometheus-stack \
  --namespace $NAMESPACE \
  --create-namespace \
  --set grafana.adminUser=${GRAFANA_ADMIN} \
  --set grafana.adminPassword=${GRAFANA_PASSWORD} \
  --set grafana.persistence.type=pvc \
  --set grafana.persistence.enabled=true \
  --set grafana.persistence.storageClass=longhorn \
  --set "grafana.persistence.accessModes={ReadWriteMany}" \
  --set grafana.persistence.size=8Gi \
  --set grafana.resources.requests.memory=512Mi \
  --set-json 'grafana.affinity={"nodeAffinity":{"preferredDuringSchedulingIgnoredDuringExecution":[{"weight":100,"preference":{"matchExpressions":[{"key":"model","operator":"In","values":["Pi5"]}]}}]}}' \
  --set prometheus.prometheusSpec.storageSpec.volumeClaimTemplate.spec.storageClassName=longhorn \
  --set "prometheus.prometheusSpec.storageSpec.volumeClaimTemplate.spec.accessModes={ReadWriteMany}" \
  --set prometheus.prometheusSpec.storageSpec.volumeClaimTemplate.spec.resources.requests.storage=4Gi \
  --set prometheus.prometheusSpec.retention=14d \
  --set prometheus.prometheusSpec.retentionSize=8GiB \
  --set prometheus.prometheusSpec.resources.requests.memory=2Gi \
  --set-json 'prometheus.prometheusSpec.affinity={"nodeAffinity":{"preferredDuringSchedulingIgnoredDuringExecution":[{"weight":100,"preference":{"matchExpressions":[{"key":"model","operator":"In","values":["Pi5"]}]}}]}}'
-Sandy


Leave a Reply