Blog

  • Record Player Visualizer

    The “Problem”

    We’ve moved from California to Chicago, and our new place came with an included TV / soundbar combo in the living room. It’s a 75″ Sammy TV – sort of hung in the middle of the wall so it “needed” some sort of media side-board/credenza/buffet underneath to balance the wall. I lived with the media hutch for about a week. Then thought: “I have low slung media credence and an available input on the soundbar – it needs a turntable on top”.

    The soundbar is a Samsung 2.1 jobbie that is coupled to the TV by HDMI/eARC – which leaves a spare HDMI input open. So my plan was to connect the HDMI port to a $12 wonder ADC and run audio into the soundbar from an old Yamaha turntable.

    With enough pre-amps, converter boxes and a power bar, I was able to get it all hooked up, but there was a problem.
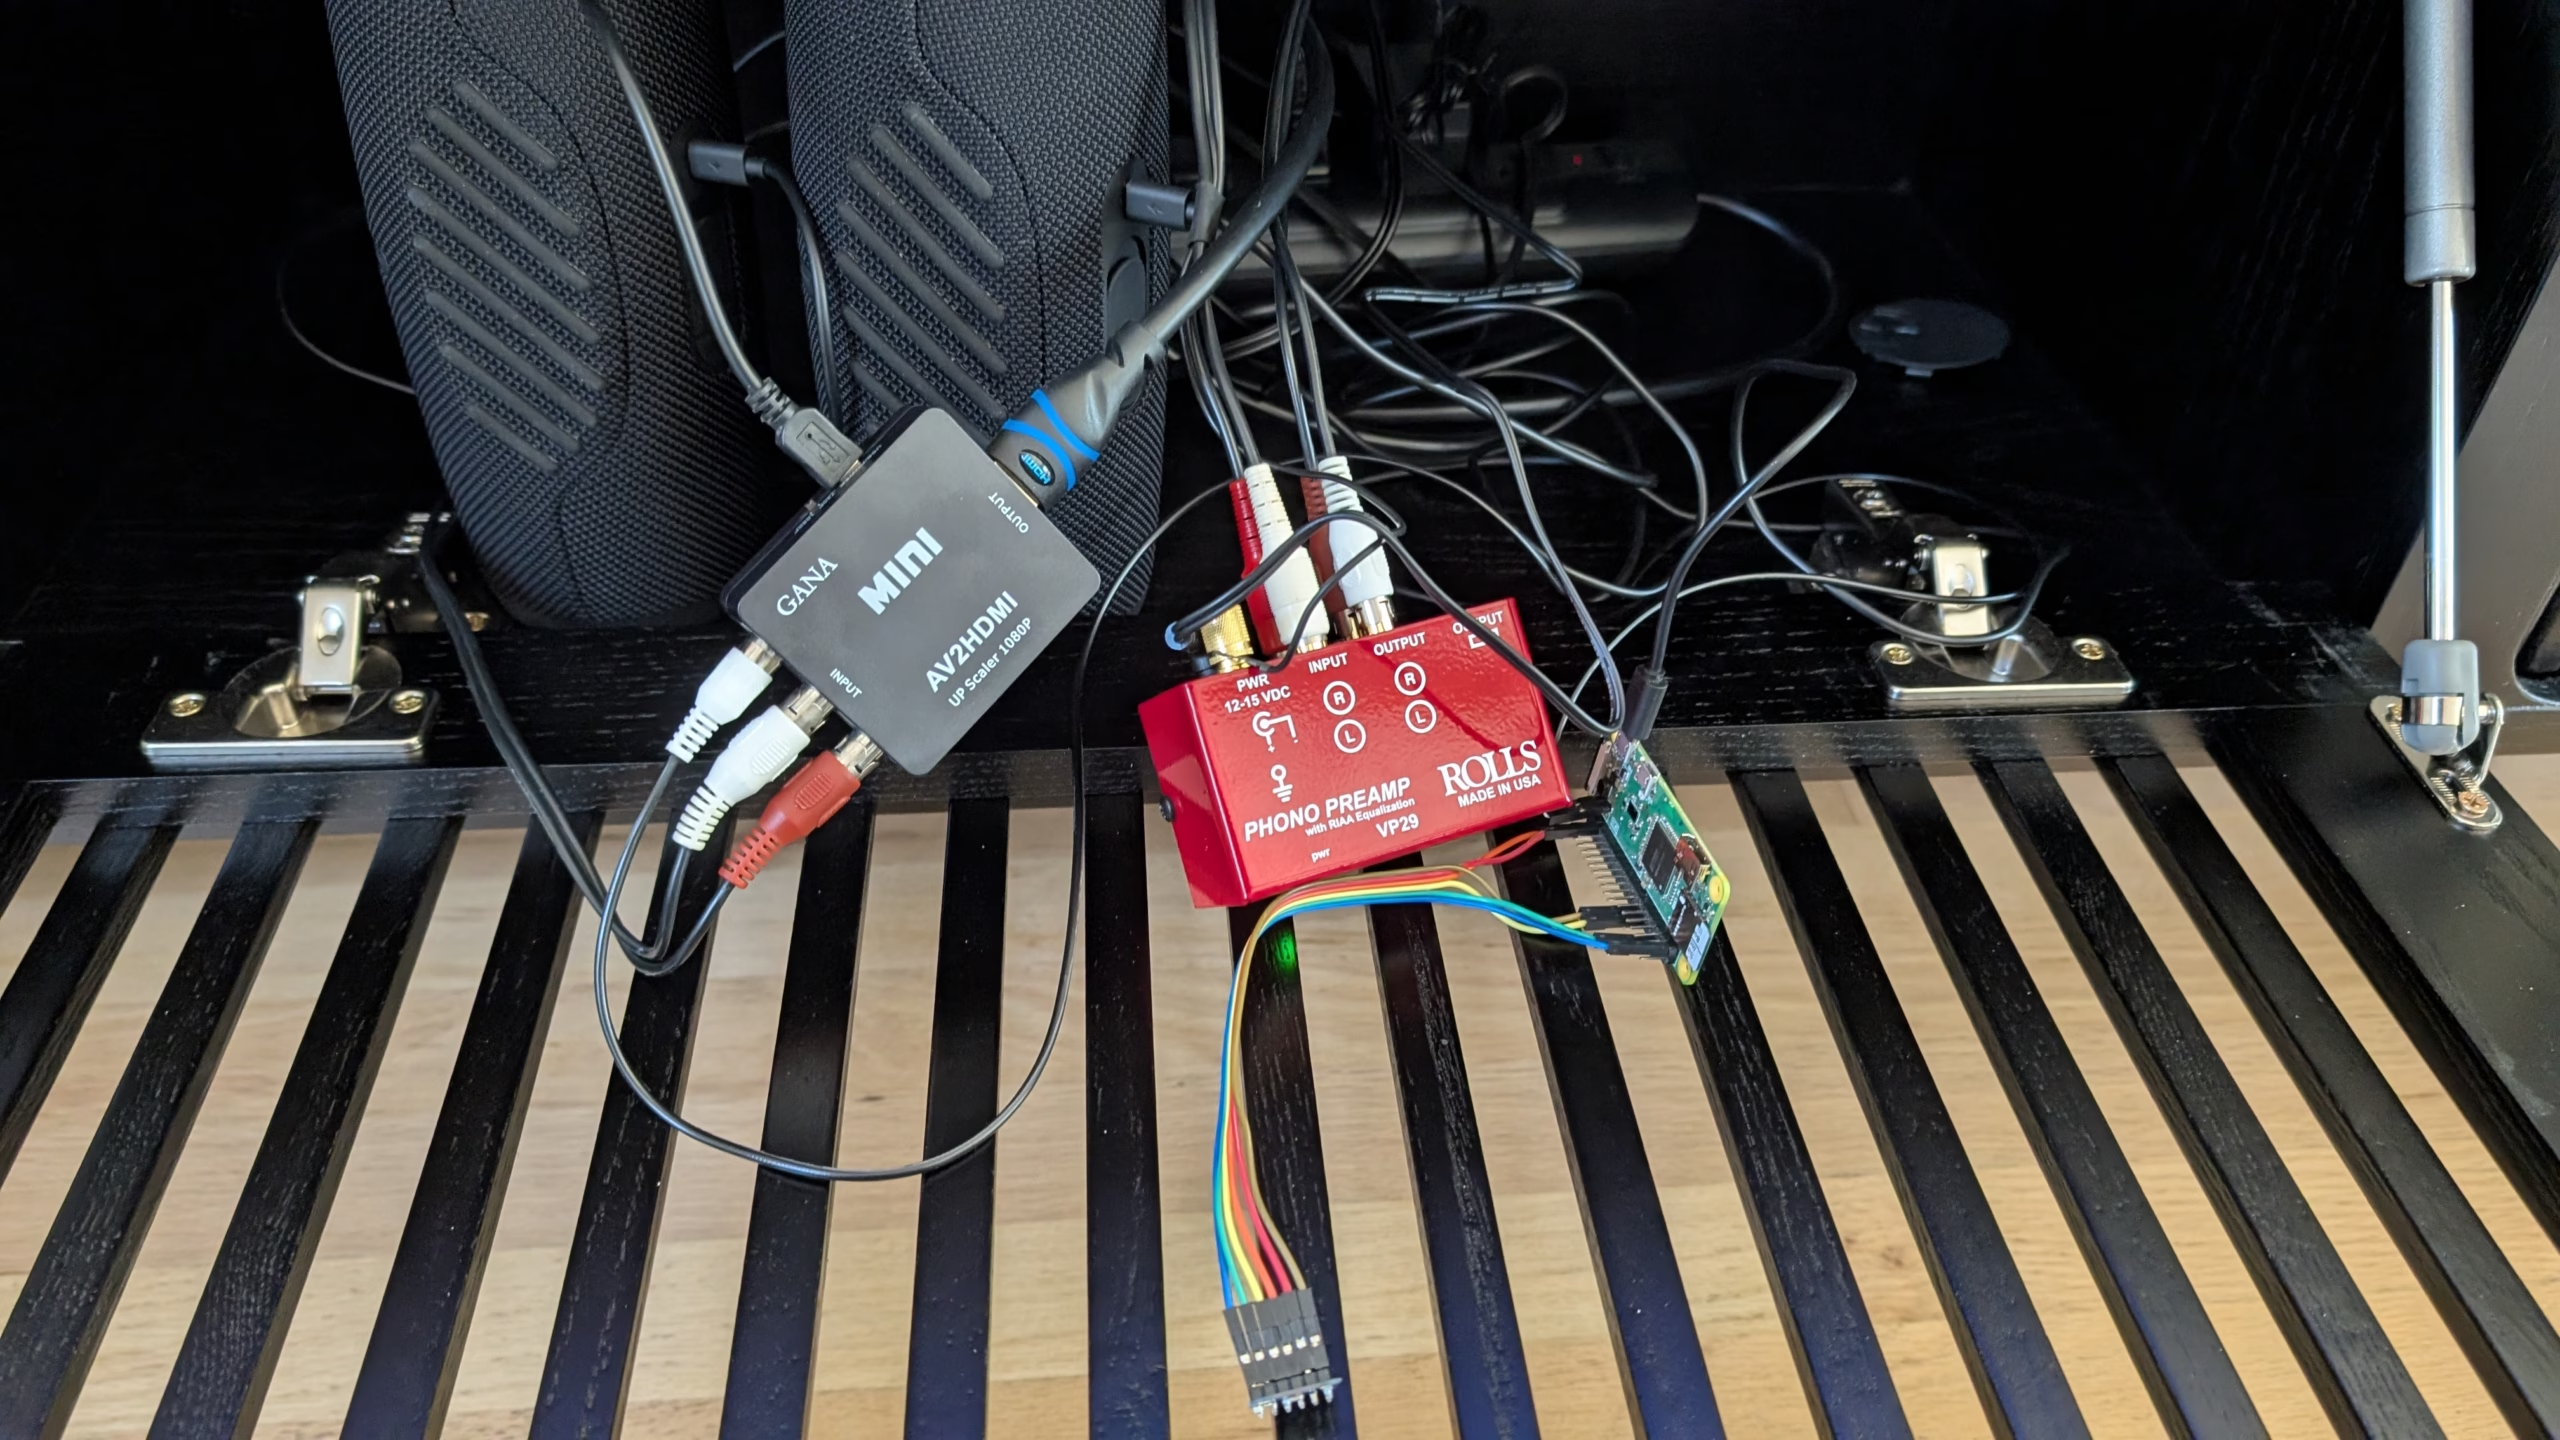
    The soundbar doesn’t have independent power control – it’s tied to the TV. So to hear the turntable, the TV has to be on and displaying the video from the converter box. Weirdly, ’70s record players don’t have any sort of video output, so I just left it unconnected on the converter. But that means the converter outputs a blue screen saying “No Signal” – gross.

    My Kingdom for a Composite Source

    Now I had free composite video input and nothing to hang off of it. Maybe I could build something with a Pi Zero to show on the screen while I listen to my records. So after asking Gemini the wrong question (how to convert – rpi convert HDMI to composite?) it pointed out that my pi zero already has composite output – der. You just have to solder some pins on there and (after a wasted Saturday) bob’s ur uncle.
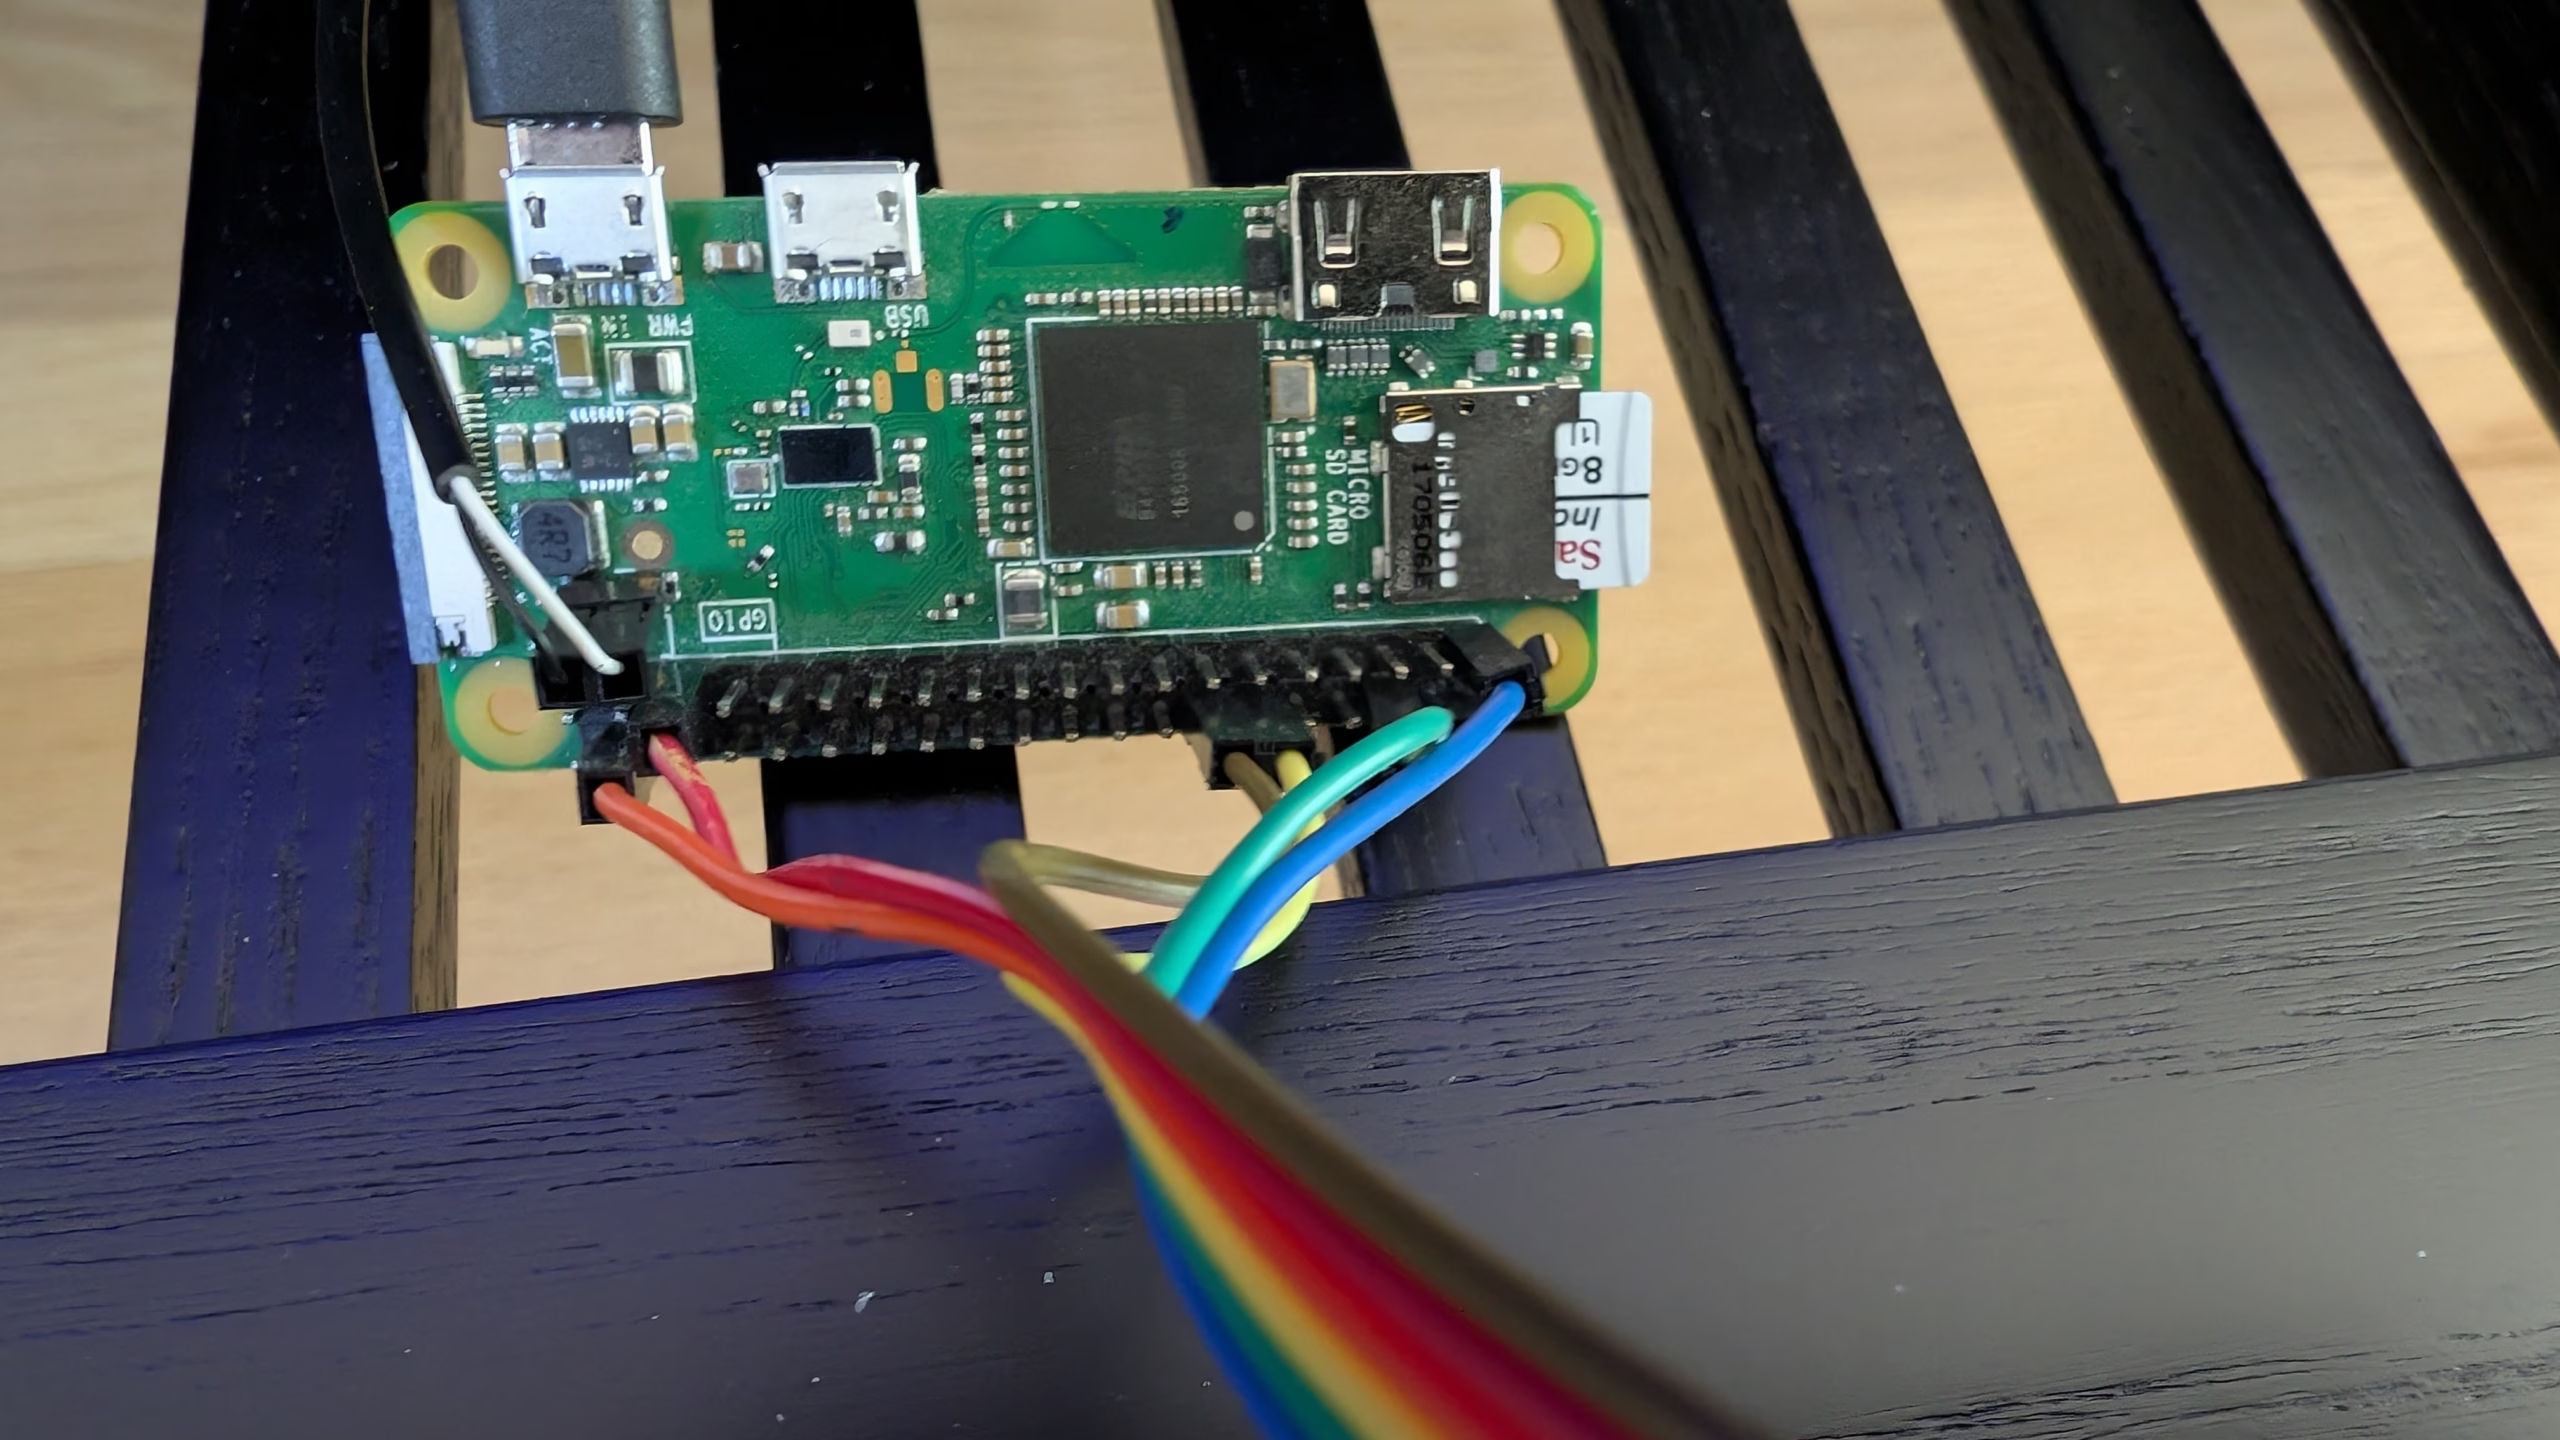
    A spare left channel wire from an RCS cable with it’s end cut off (black and white wires leading off to a sleeved cable). I crimped DuPont connectors on the wires to plug onto the pins I soldered on the board. Ribbon cable on the GPIO pins is mic input explained below…

    The rPi doesn’t output composite video without some OS configuration. So I flashed a copy or Raspberry Pi OS (Legacy, 32-bit) onto a 8GB microsd card and booted up the computer. I used the rPi imager and enabled SSH and wifi in the settings. To get composite output, you have to fiddle with the boot configuration:

    In /boot/firmware/config.txt is have settings like this:

    ...
    dtoverlay=vc4-kms-v3d,noaudio,composite
    ...
    sdtv_mode=0
    hdmi_ignore_hotplug=1
    sdtv_aspect=3

    This disables HDMI audio output and enables composite video. There’s some standard def TV settings to – this basically gets me a 720×480 (interlaced?) output to feed to the HDMI converter box. sdtv_mode=0 is for NTSC.

    I also had to hack on the kernel cmdline.txt to add this on the end of the command

    video=Composite-1:720x480@60ie,margin_top=40,margin_right=40,margin_bottom=40,margin_left=40

    This sets a video mode and crops in the margins a bit – the picture getting to the TV was too big in all directions the margin settings trim it back in.

    With all that set, I could boot to the rPi lxde desktop which was an improvement over the No Signal screen1. It’s really low resolution for that TV, (sort of like watching VHS on your fancy TV).
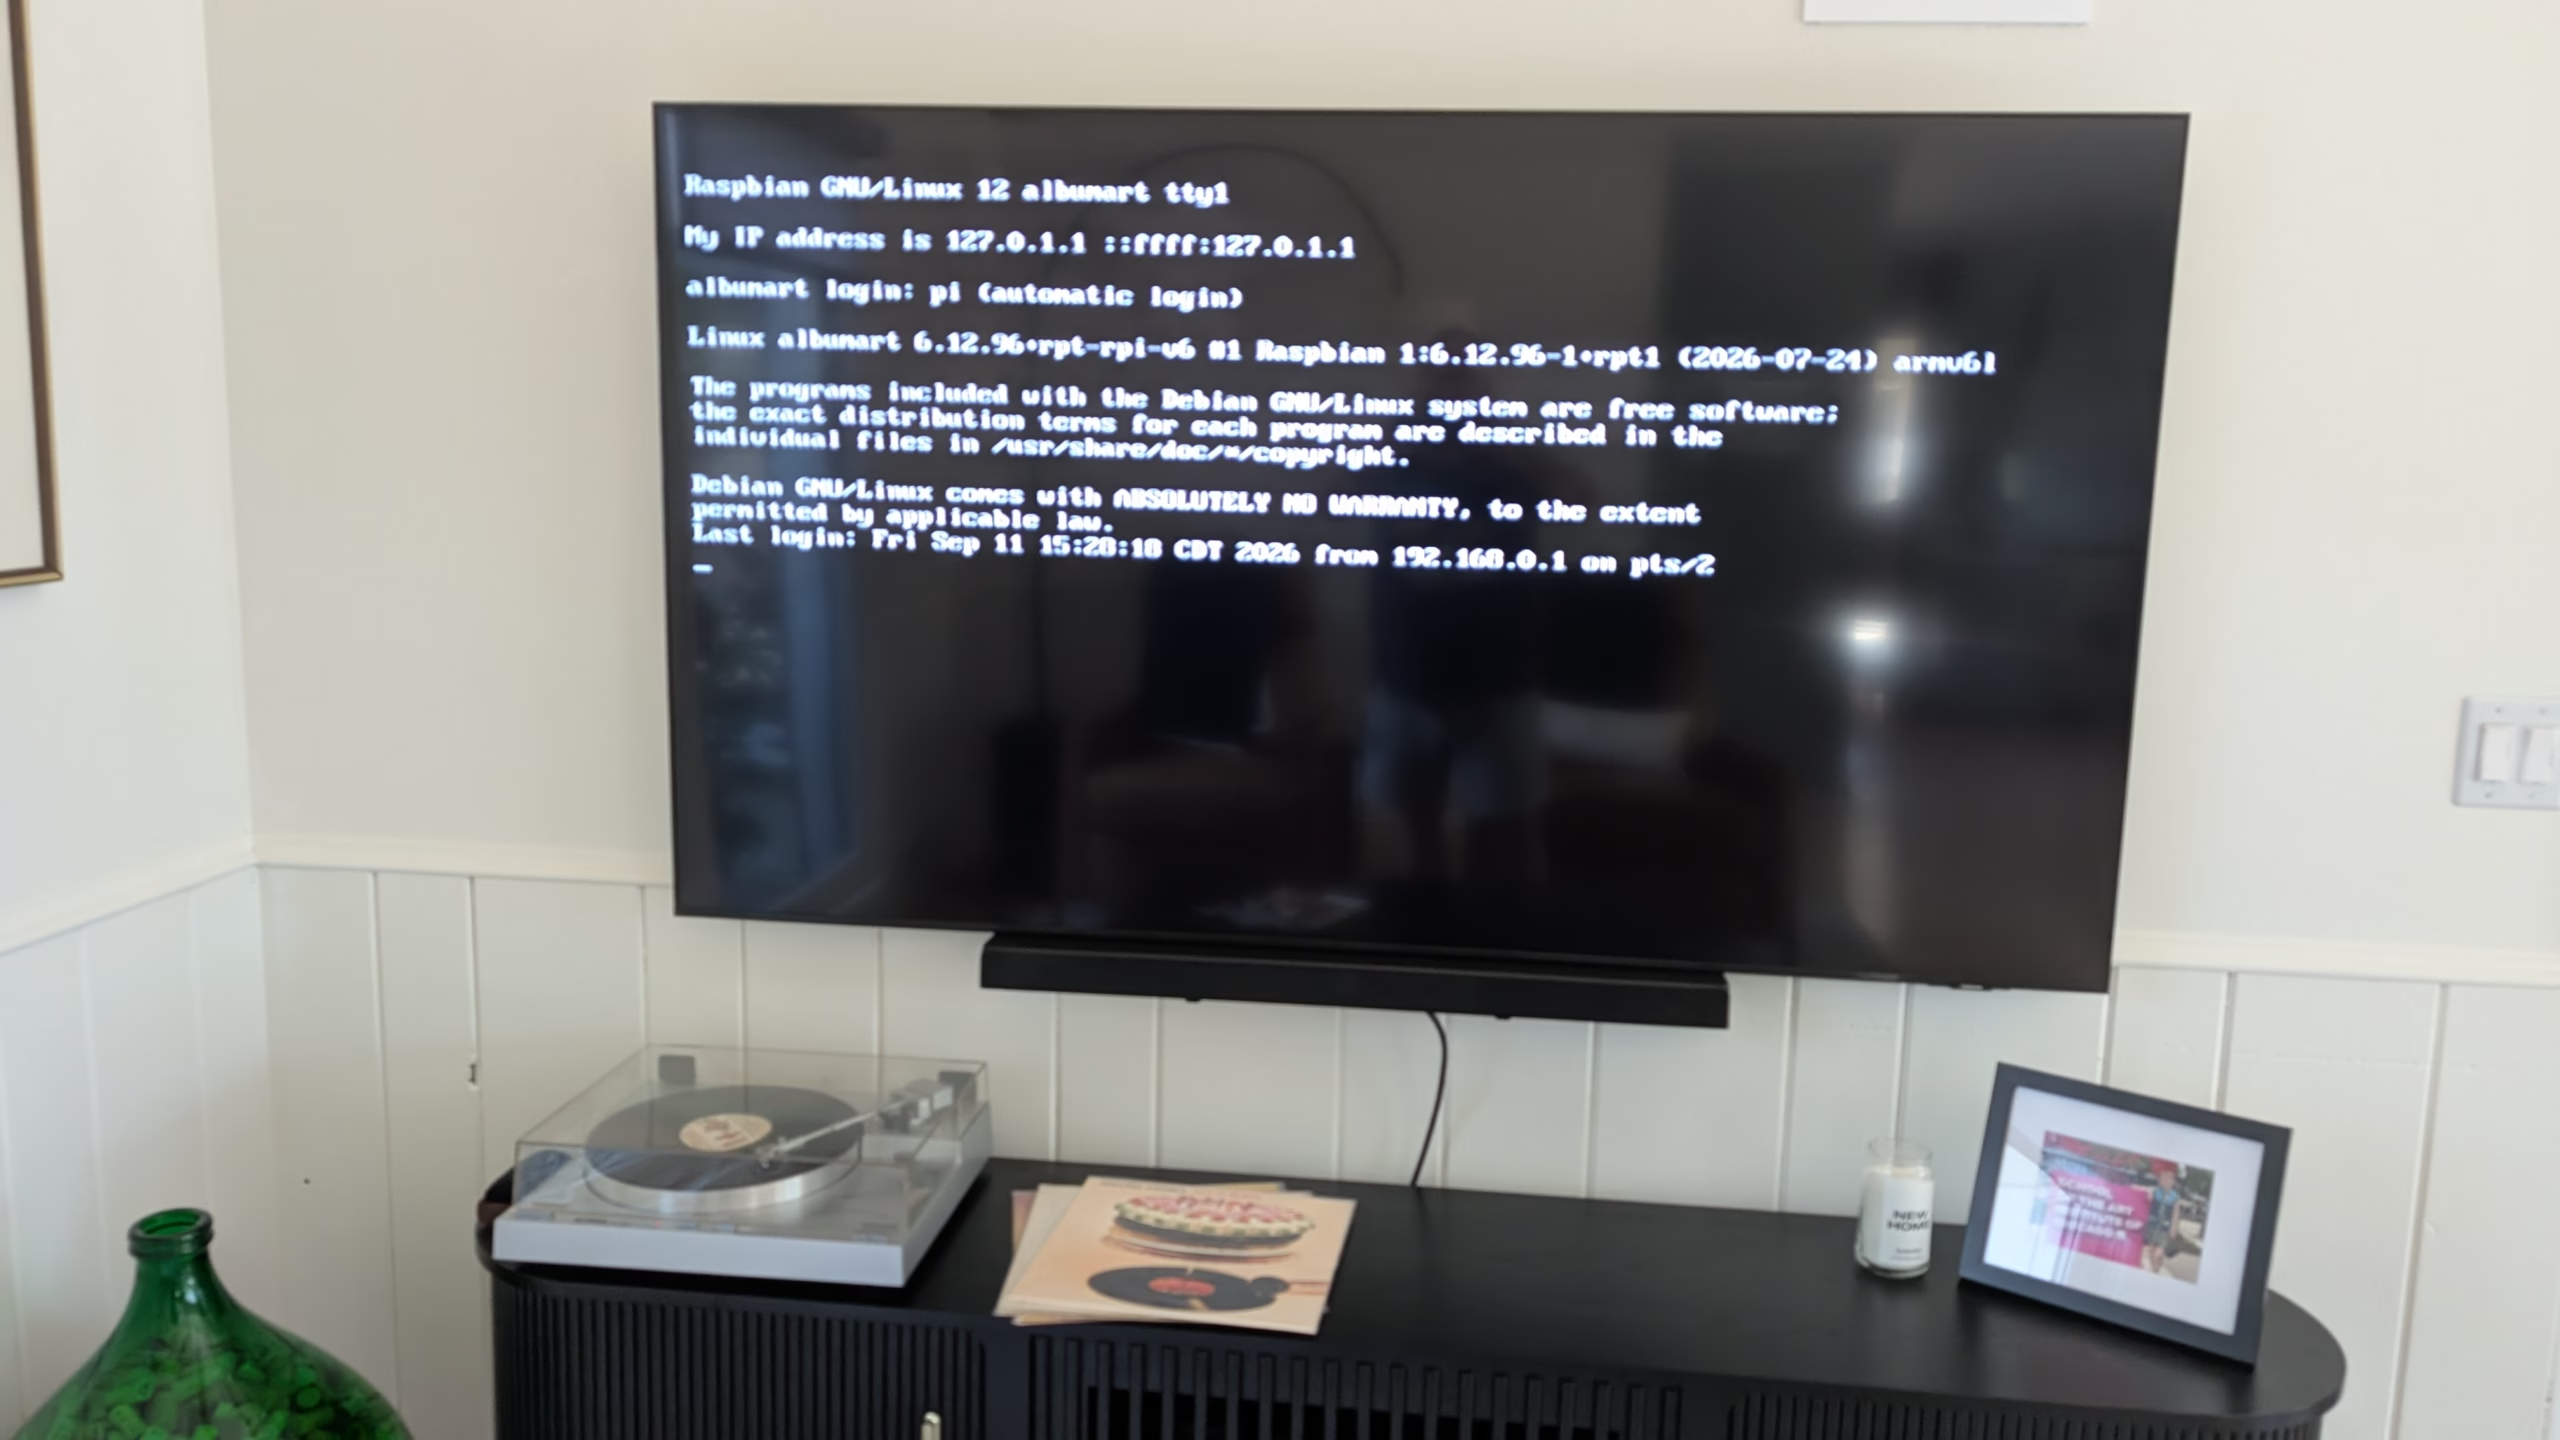
    Linux in the Living Room?!

    Audio Input

    Initially I thought I’d write a python script to listen and pick album art by calling shazamio. I got that script mostly working on my laptop, getting and running python on the pizero seemed like a bit much. Then I though maybe I could get a Milkdrop (linux Winamp for Grandpa) style visualizer going. Either way, I was gonna need some audio input to feed the thing. There are USB microphones that work great with Raspberry PI OS, but with a pizero you’d need a OTG cable and the mic – so you’re probably well into $30 for the mic. I opted for this i2S MEMS instead.
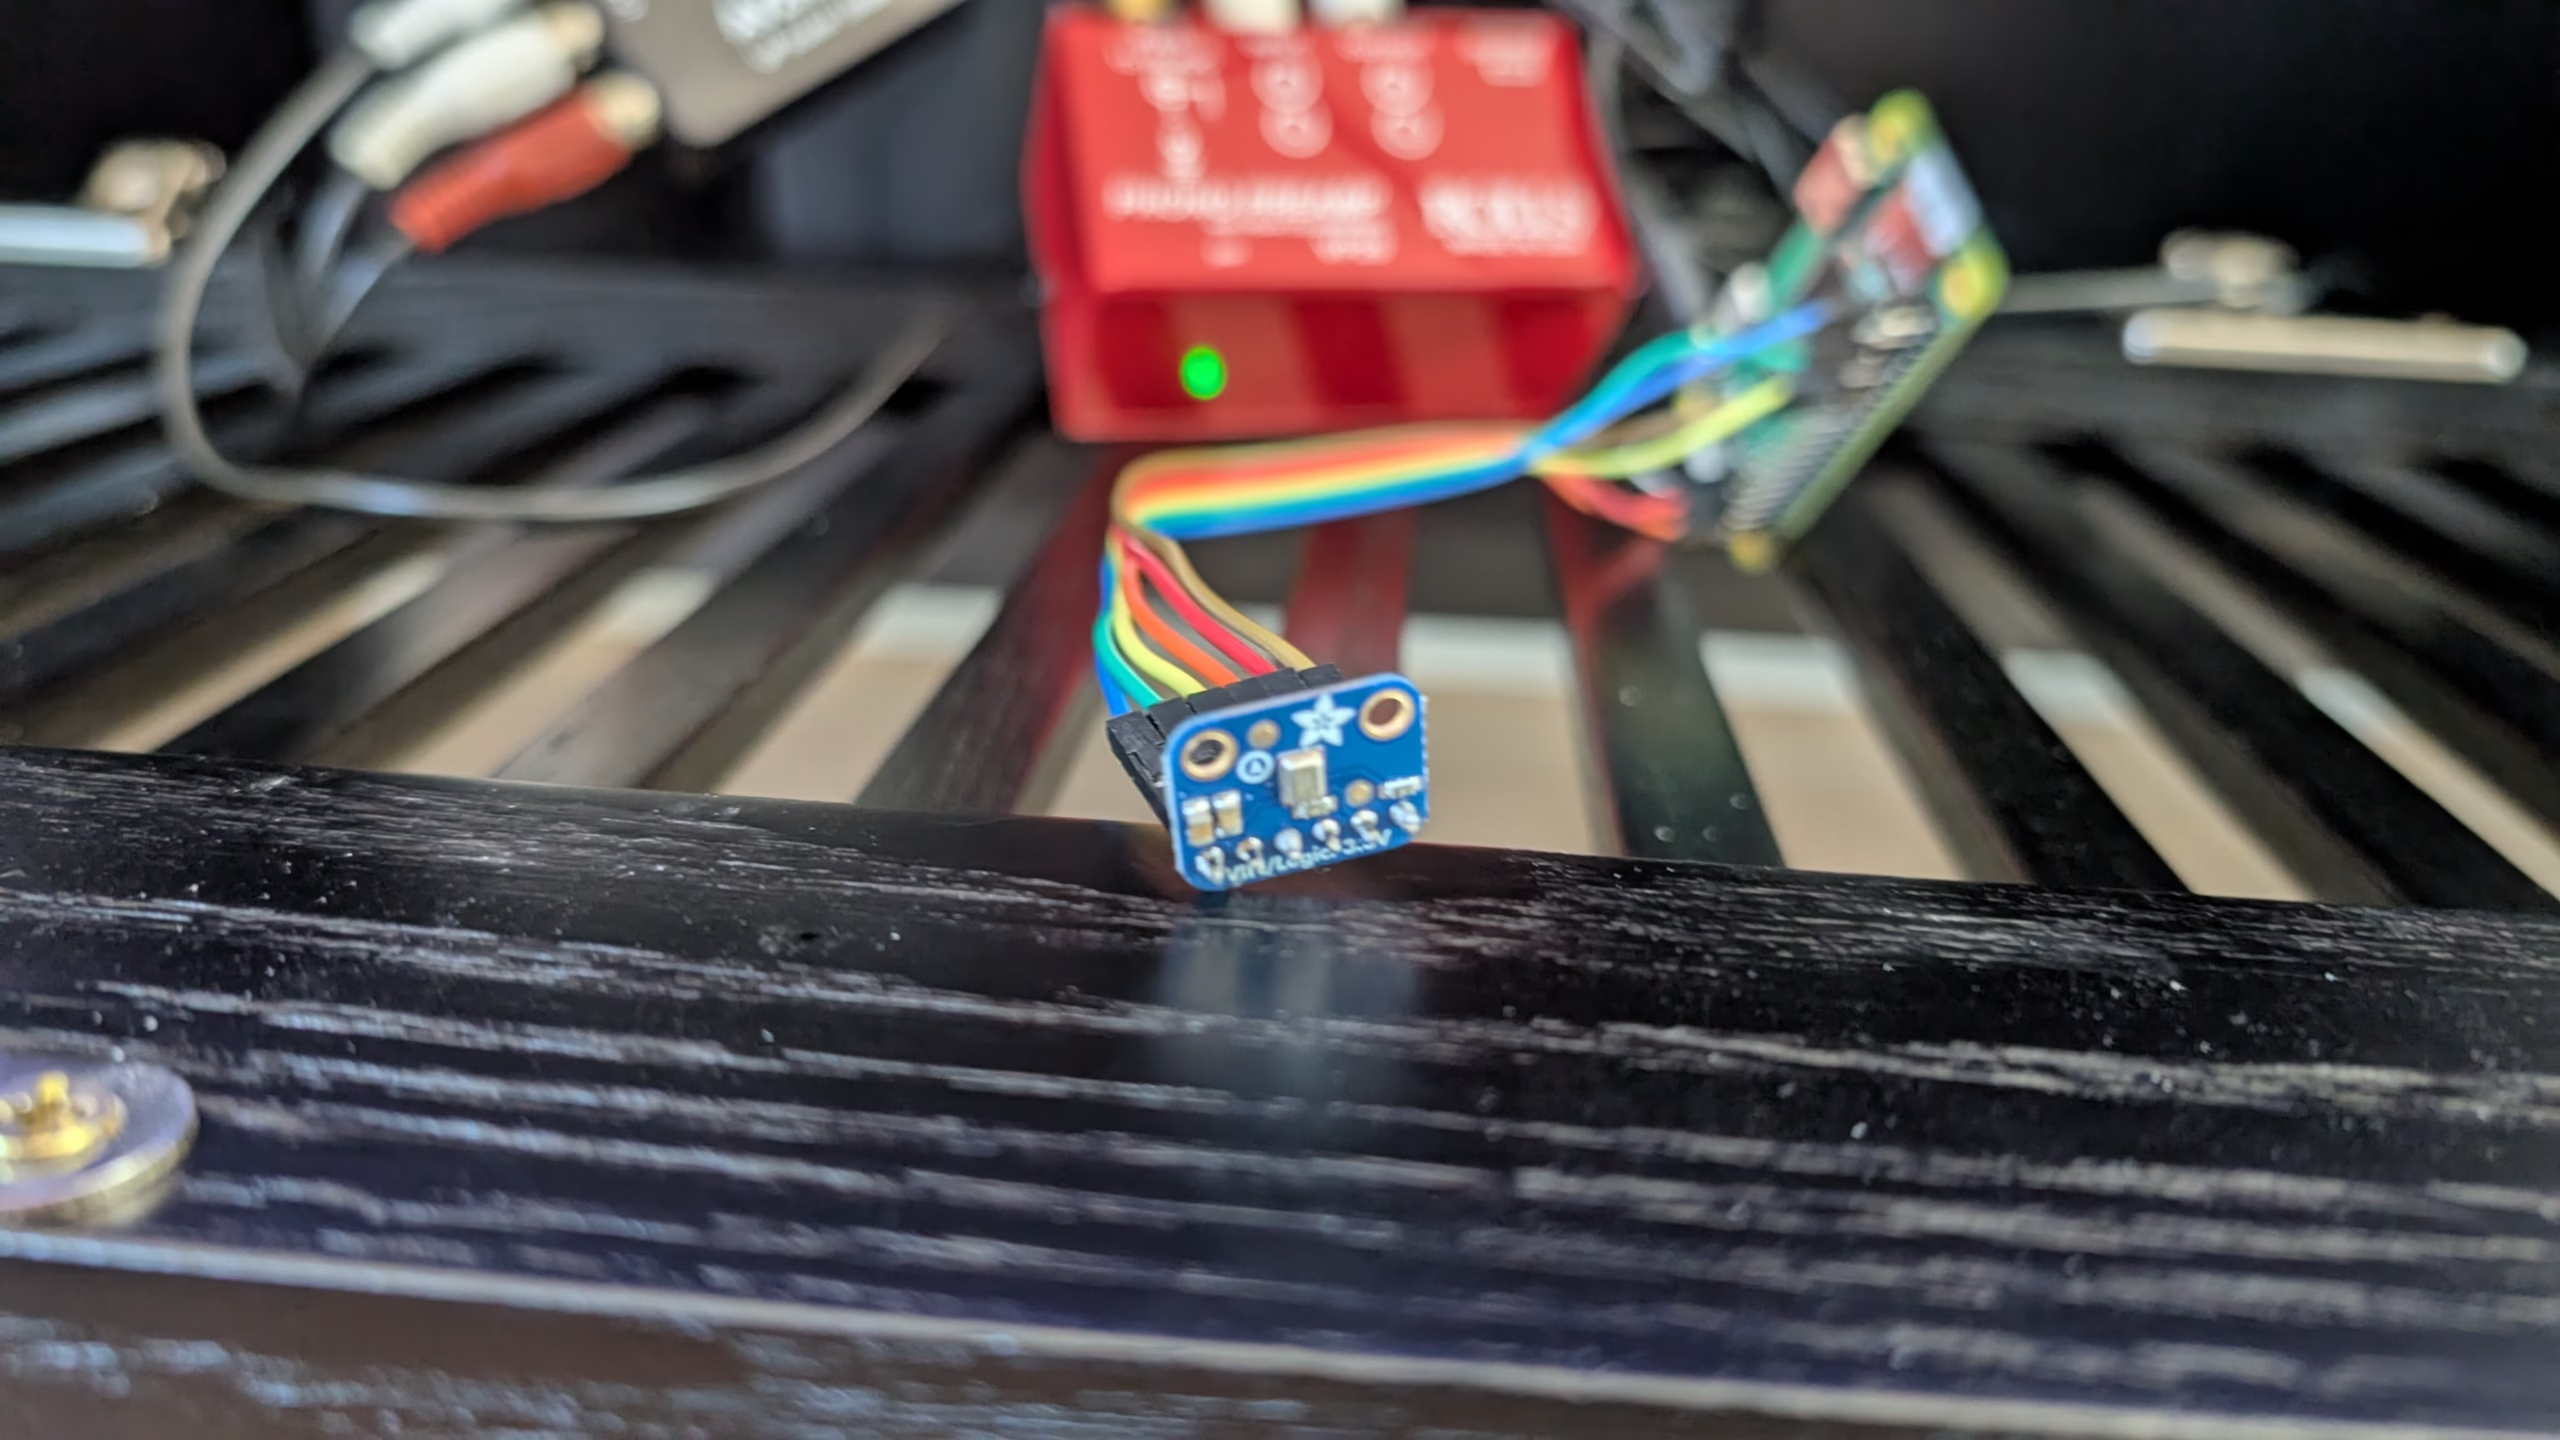
    AdaFruit’s I2S MEMS mic breakout board

    Then put pin headers on the pizero and connected it up (the ribbon cable in the image above).

    Back into the /boot/firmware/config.txt file to enable the device:

    dtparam=i2s=on
    dtoverlay=googlevoicehat-soundcard

    Then setup some alsa configs in /etc/asound.conf

    cm.mic_hw {
        type hw
        card 0         # <--- CHANGE THIS: Your Google Voice HAT card number
        device 0       # Usually 0 for this device
        channels 2     # Google Voice HAT mic is stereo
        format S32_LE  # Common format; can use S32_LE if your mic supports it better
        rate 48000     # Common sample rate for AIY HAT mic
    }
    # Define the software volume control layer
    pcm.mic_sv {
        type softvol
        slave {
            pcm "mic_hw"
        }
        control {
            name "Mic Capture Volume"
            card 0 # <--- USE THE SAME CARD NUMBER AS ABOVE
        }
        min_dB -3.0   # Minimum dB gain
        max_dB 20.0   # Maximum dB gain - You can go higher if needed
        resolution 256
    }
    # Make this new software volume device the default for capture
    pcm.!default {
        type asym
        playback.pcm "default"  # Keep default playback (e.g., HDMI)
        capture.pcm "mic_sv"    # Use our softvol device for capture
    }


    Then crank the volume with alsamixer....

    Visualizer

    In reality, Milkdrop or similar hw accelerated visuals were gonna be out of the question on a pi zero. What I found eventually was Cava. No python version/dependency hassle (I was gonna have to build a more recent version of python on the pi to get my album art script working - yuck) - no external GPU - no internet API listening to everything you are saying. Cava shows spectrum analyzer output as ncurses characters in a terminal so it runs on low spec hw.

    With that selected, I was gonna need to have the pi automatically login to the desktop:

    sudo raspi-config
    System Options -> Auto Login

    And allow auto login to the console and desktop.

    Great now I needed a full screen terminal and the cava program:

    sudo apt install -y cava terminator

    My config file for cava looks like this (in /home/pi/.config/cava/config):

    # Configuration file for CAVA. Default values are commented out. Use either ';' or '#' for commenting.

    [general]

    # Smoothing mode. Can be 'normal', 'scientific' or 'waves'. DEPRECATED as of 0.6.0
    ; mode = normal

    # Accepts only non-negative values.
    framerate = 60

    # 'autosens' will attempt to decrease sensitivity if the bars peak. 1 = on, 0 = off
    # new as of 0.6.0 autosens of low values (dynamic range)
    # 'overshoot' allows bars to overshoot (in % of terminal height) without initiating autosens. DEPRECATED as of 0.6.0
    autosens = 1
    overshoot = 100

    # Manual sensitivity in %. If autosens is enabled, this will only be the initial value.
    # 200 means double height. Accepts only non-negative values.
    sensitivity = 100

    # The number of bars (0-200). 0 sets it to auto (fill up console).
    # Bars' width and space between bars in number of characters.
    ; bars = 0
    ; bar_width = 2
    ; bar_spacing = 1


    # Lower and higher cutoff frequencies for lowest and highest bars
    # the bandwidth of the visualizer.
    # Note: there is a minimum total bandwidth of 43Mhz x number of bars.
    # Cava will automatically increase the higher cutoff if a too low band is specified.
    lower_cutoff_freq = 30
    higher_cutoff_freq = 11000


    # Seconds with no input before cava goes to sleep mode. Cava will not perform FFT or drawing and
    # only check for input once per second. Cava will wake up once input is detected. 0 = disable.
    ; sleep_timer = 0


    [input]

    # Audio capturing method. Possible methods are: 'pulse', 'alsa', 'fifo', 'sndio' or 'shmem'
    # Defaults to 'pulse', 'alsa' or 'fifo', in that order, dependent on what support cava was built with.
    #
    # All input methods uses the same config variable 'source'
    # to define where it should get the audio.
    #
    # For pulseaudio 'source' will be the source. Default: 'auto', which uses the monitor source of the default sink
    # (all pulseaudio sinks(outputs) have 'monitor' sources(inputs) associated with them).
    #
    # For alsa 'source' will be the capture device.
    # For fifo 'source' will be the path to fifo-file.
    # For shmem 'source' will be /squeezelite-AA:BB:CC:DD:EE:FF where 'AA:BB:CC:DD:EE:FF' will be squeezelite's MAC address
    ; method = pulse
    ; source = auto

    method = alsa
    ; source = hw:Loopback,1
    source = hw:0,0

    ; method = fifo
    ; source = /tmp/mpd.fifo
    ; sample_rate = 44100
    ; sample_bits = 16

    ; method = shmem
    ; source = /squeezelite-AA:BB:CC:DD:EE:FF

    ; method = portaudio
    ; source = auto


    [output]

    # Output method. Can be 'ncurses', 'noncurses' or 'raw'.
    # 'noncurses' uses a custom framebuffer technique and draws only changes
    # from frame to frame. 'ncurses' is default if supported
    #
    # 'raw' is an 8 or 16 bit (configurable via the 'bit_format' option) data
    # stream of the bar heights that can be used to send to other applications.
    # 'raw' defaults to 200 bars, which can be adjusted in the 'bars' option above.
    ; method = ncurses

    # Visual channels. Can be 'stereo' or 'mono'.
    # 'stereo' mirrors both channels with low frequencies in center.
    # 'mono' outputs left to right lowest to highest frequencies.
    # 'mono_option' set mono to either take input from 'left', 'right' or 'average'.
    channels = mono
    mono_option = average

    # Raw output target. A fifo will be created if target does not exist.
    ; raw_target = /dev/stdout

    # Raw data format. Can be 'binary' or 'ascii'.
    ; data_format = binary

    # Binary bit format, can be '8bit' (0-255) or '16bit' (0-65530).
    ; bit_format = 16bit

    # Ascii max value. In 'ascii' mode range will run from 0 to value specified here
    ; ascii_max_range = 1000

    # Ascii delimiters. In ascii format each bar and frame is separated by a delimiters.
    # Use decimal value in ascii table (i.e. 59 = ';' and 10 = '\n' (line feed)).
    ; bar_delimiter = 59
    ; frame_delimiter = 10

    [color]
    # Colors can be one of seven predefined: black, blue, cyan, green, magenta, red, white, yellow.
    # Or defined by hex code '#xxxxxx' (hex code must be within ''). User defined colors requires
    # ncurses output method and a terminal that can change color definitions such as Gnome-terminal or rxvt.
    # if supported, ncurses mode will be forced on if user defined colors are used.
    # default is to keep current terminal color
    ; background = default
    ; foreground = default

    # Gradient mode, only hex defined colors (and thereby ncurses mode) are supported,
    # background must also be defined in hex or remain commented out. 1 = on, 0 = off.
    # You can define as many as 8 different colors. They range from bottom to top of screen
    gradient = 1
    gradient_count = 7
    gradient_color_1 = '#8b00ff'
    gradient_color_2 = '#4b0082'
    gradient_color_3 = '#0000ff'
    gradient_color_4 = '#00ff00'
    gradient_color_5 = '#ffff00'
    gradient_color_6 = '#ff7f00'
    gradient_color_7 = '#ff0000'

    [smoothing]

    # Percentage value for integral smoothing. Takes values from 0 - 100.
    # Higher values means smoother, but less precise. 0 to disable.
    integral = 70

    # Disables or enables the so-called "Monstercat smoothing" with or without "waves". Set to 0 to disable.
    monstercat = 1
    waves = 1

    # Set gravity percentage for "drop off". Higher values means bars will drop faster.
    # Accepts only non-negative values. 50 means half gravity, 200 means double. Set to 0 to disable "drop off".


    # In bar height, bars that would have been lower that this will not be drawn.
    ignore = 2

    noise_reduction = 60


    [eq]
    # This one is tricky. You can have as much keys as you want.
    # Remember to uncomment more then one key! More keys = more precision.
    # Look at readme.md on github for further explanations and examples.
    1 = 1 # bass
    2 = 1
    3 = 1 # midtone
    4 = 1
    5 = 2 # treble

    Cava configuration is a bit of a black-hole - I spent a lot of time trying to tweak the smoothing and colors - basically the look and feel. The critically git is the [sound] config where I hook up the alsa hw:0.0 device I created earlier. I also set autosens since the dynamics into the microphone vary widely. monstercat and waves just cause I thought they look cool.

    to get a fullscreen terminal with no decorations I configured terminator like this (in /home/pi/.config/terminator/config)

    global_config]
    tab_position = hidden
    hide_tabbar = True
    handle_size = 0
    window_state = fullscreen
    borderless = True

    [profiles]
    [[default]]
    show_titlebar = False
    scrollbar_position = disabled

    Finally to have it run when the desktop starts up I added /home/pi/.config/autostart/cava.desktop:

    Desktop Entry]
    Type=Application
    Name=Cava Terminal
    Exec=/usr/bin/terminator --config /home/pi/.config/terminator/config --fullscreen --maximize --borderless -e "/usr/bin/cava -p /home/pi/.config/cava/config"
    Terminal=false

    After a couple reboots and some trial and error I finally to the screen too look like this:
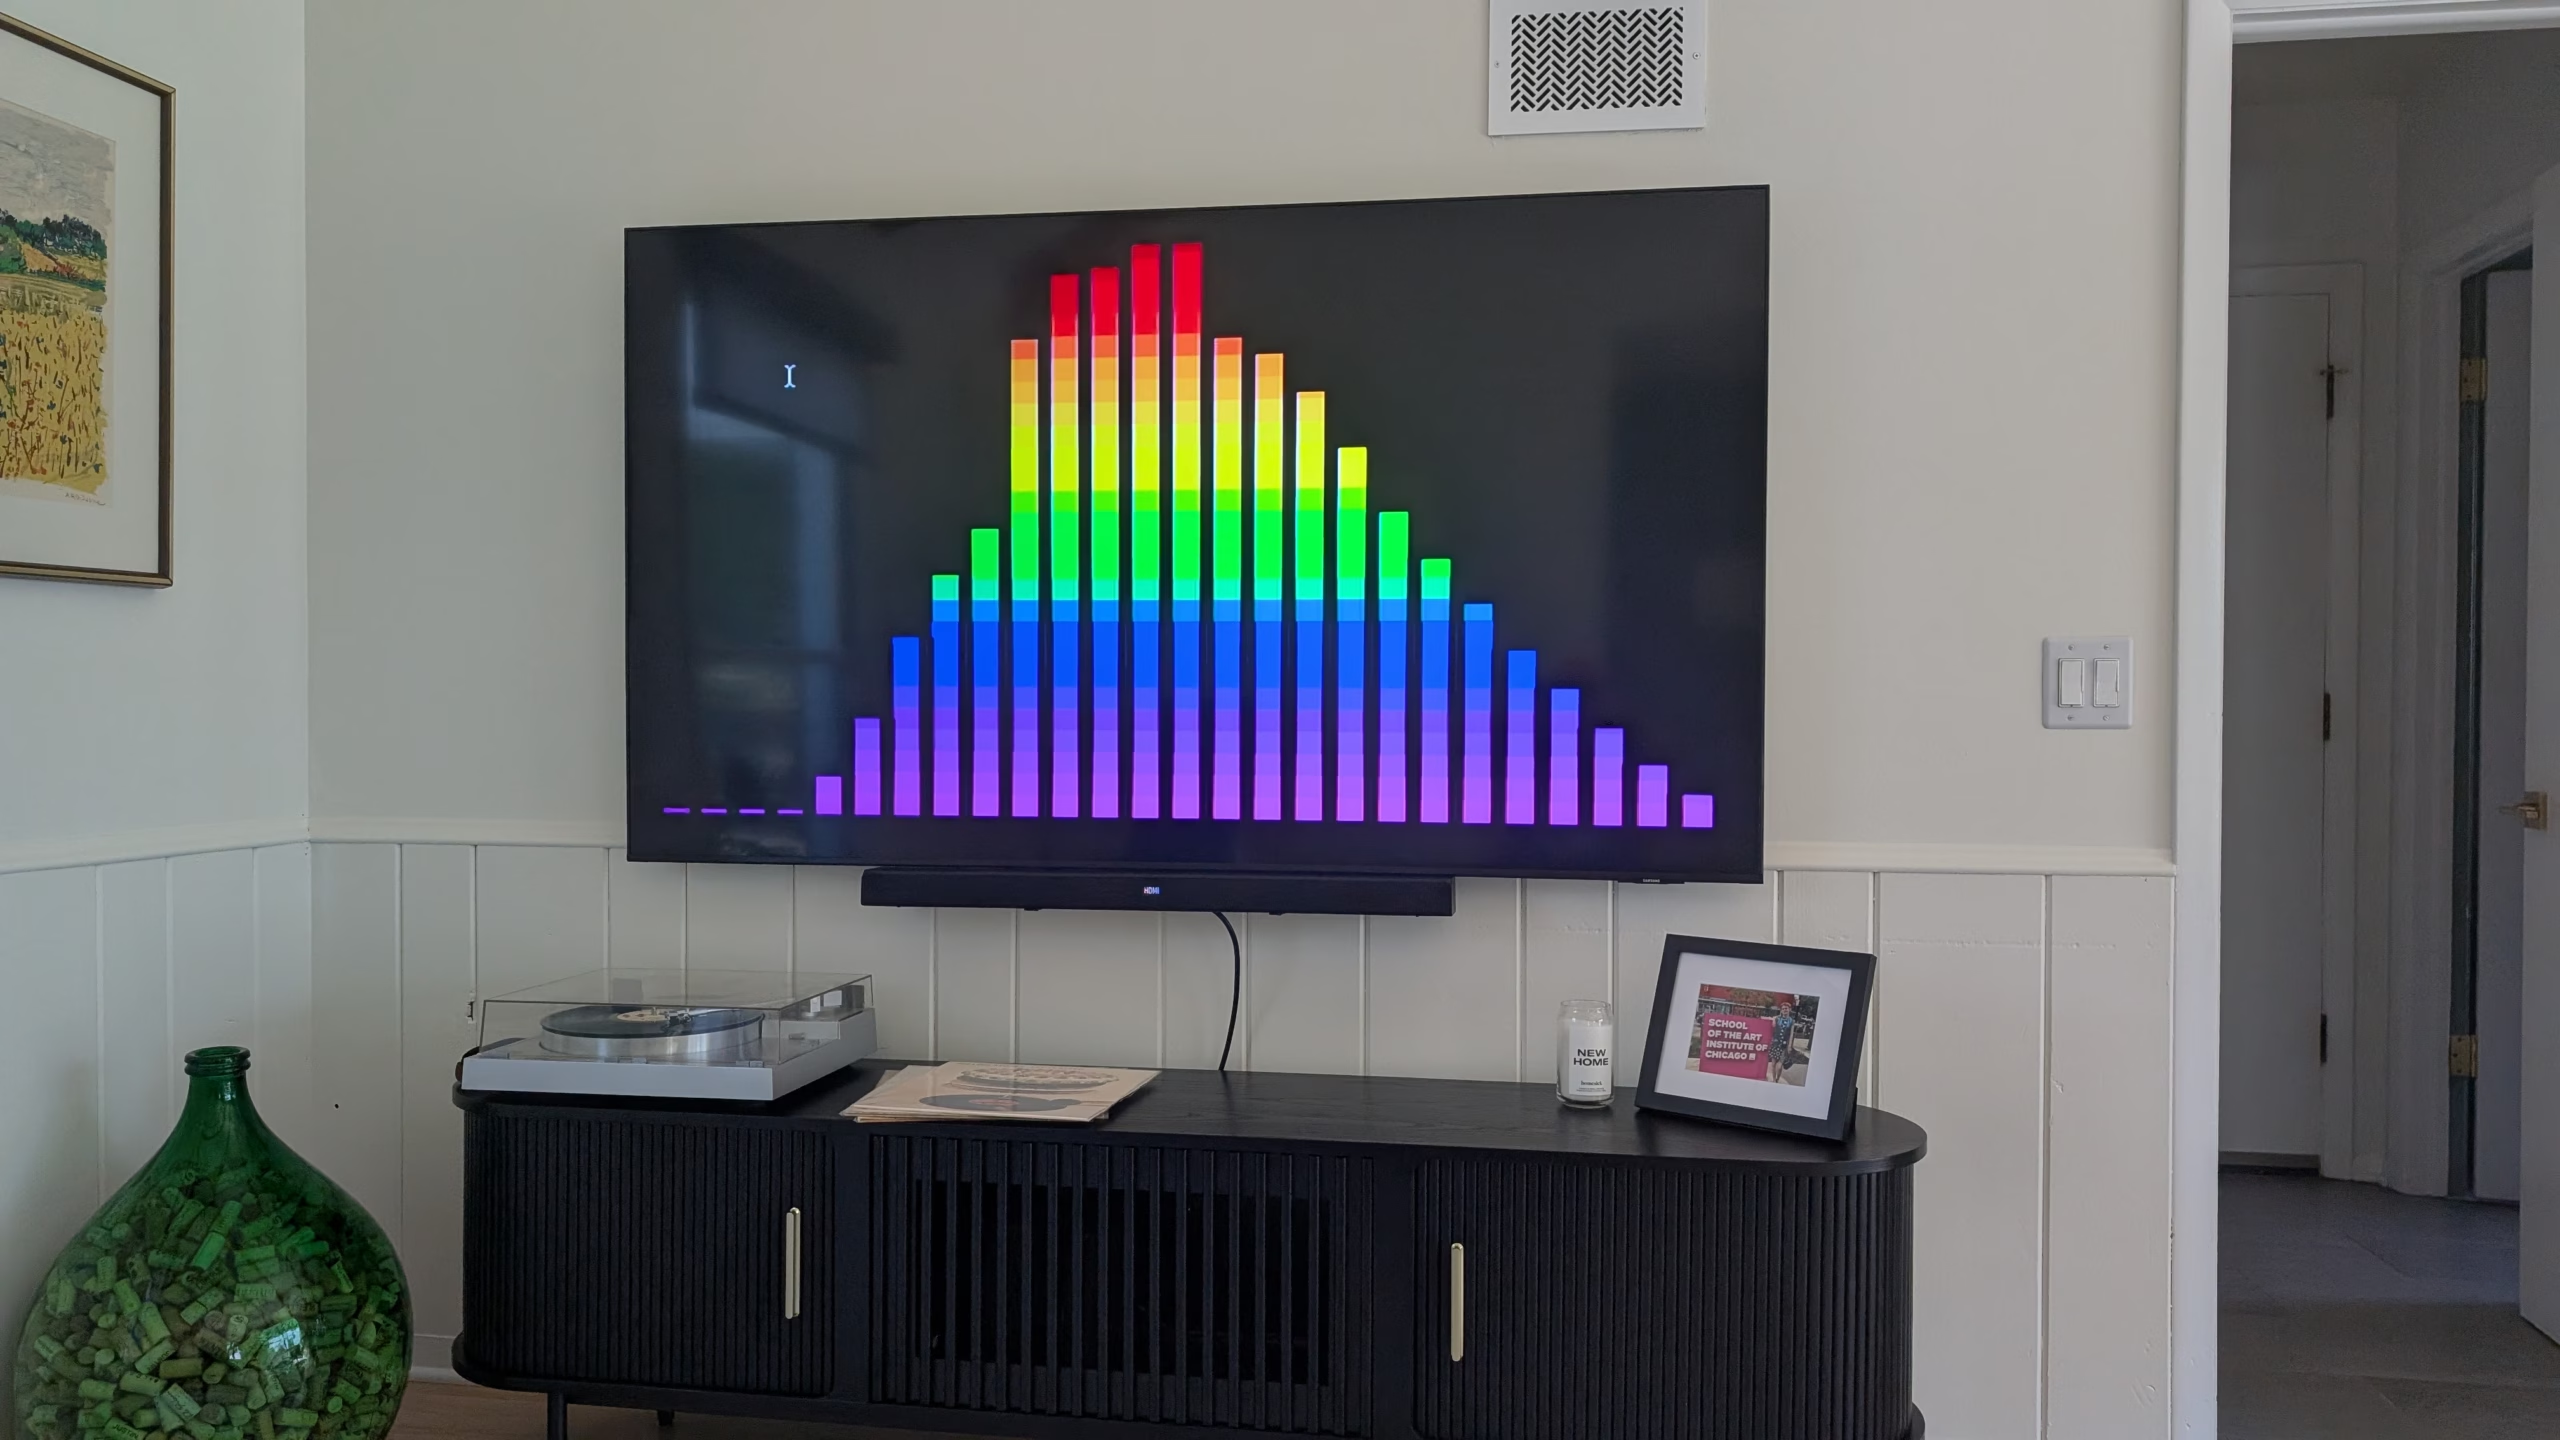
    Its basically listening to sound in the room and trying to display the frequency spectrum of the sound. It's not perfect but much better than the blue screen I started with.

    Play it loud...

    1. well not exactly - I've never hooked up a keyboard/mouse on this computer I just ssh into it - so to get to the desktop, I had to use raspi-config to automate the login â†Šī¸Ž
  • Arkade Load Testing with k6

    This time I’m going to add k6 load testing to the Arkade kubernetes cluster. k6 gives you a javascript interface to setup load testing against a group of webservers. I’m going to try to set it up to test the various game servers in my pi-cluster.

    Tools

    Install the k6 command line tool. I added this to my tools.sh setup script:

    echo "Install k6"
    sudo gpg -k
    sudo gpg --no-default-keyring --keyring /usr/share/keyrings/k6-archive-keyring.gpg --keyserver hkp://keyserver.ubuntu.com:80 --recv-keys C5AD17C747E3415A3642D57D77C6C491D6AC1D69
    echo "deb [signed-by=/usr/share/keyrings/k6-archive-keyring.gpg] https://dl.k6.io/deb stable main" | sudo tee /etc/apt/sources.list.d/k6.list
    sudo apt-get update
    sudo apt-get install k6

    Install The k6-operator

    Next I added in the k6-operator in the cluster. That’s done with helm as shown below:

    $ cat k6.sh
    #/bin/bash

    . ./functions.sh
    NAMESPACE=k6

    info "Setup k6 community helm repo"
    helm repo add grafana https://grafana.github.io/helm-charts
    helm repo update

    info "Install the k6 operator in the '$NAMESPACE' namespace"
    helm upgrade --install k6-operator grafana/k6-operator \
    --namespace $NAMESPACE \
    --create-namespace

    The Arkade Test Case

    A k6 test case is declared in javascript. Here’s what I came up to drive each of the game servers.

    $ cat arkade_loadtest.js 

    // k6.js
    import http from 'k6/http';
    import { sleep } from 'k6';

    export const options = {
    vus: 10,
    duration: '30s',
    };

    export default function () {

    const games = ["1943mii","20pacgal","circus","centiped","defender","dkong","gng",
    "invaders","joust","milliped","pacman","qix","robby","supertnk",
    "topgunnr","truxton","victory"];
    games.forEach((game, index) => {
    http.get('https://' + game);
    });
    sleep(1);
    }

    Test The Test

    First thing to try is running the test using the k6 cli.

    $ k6 run arkade_loadtest.js

    /\ Grafana /‾‾/
    /\ / \ |\ __ / /
    / \/ \ | |/ / / ‾‾\
    / \ | ( | (‾) |
    / __________ \ |_|\_\ \_____/

    execution: local
    script: arkade_loadtest.js
    output: -

    scenarios: (100.00%) 1 scenario, 10 max VUs, 1m0s max duration (incl. graceful stop):
    * default: 10 looping VUs for 30s (gracefulStop: 30s)


    █ TOTAL RESULTS

    HTTP
    http_req_duration..............: avg=3.55ms min=1.88ms med=2.76ms max=41.26ms p(90)=4.65ms p(95)=8ms
    { expected_response:true }...: avg=3.55ms min=1.88ms med=2.76ms max=41.26ms p(90)=4.65ms p(95)=8ms
    http_req_failed................: 0.00% 0 out of 4760
    http_reqs......................: 4760 157.511476/s

    EXECUTION
    iteration_duration.............: avg=1.07s min=1.04s med=1.05s max=1.53s p(90)=1.08s p(95)=1.15s
    iterations.....................: 280 9.265381/s
    vus............................: 10 min=10 max=10
    vus_max........................: 10 min=10 max=10

    NETWORK
    data_received..................: 26 MB 857 kB/s
    data_sent......................: 480 kB 16 kB/s


    running (0m30.2s), 00/10 VUs, 280 complete and 0 interrupted iterations
    default ✓ [======================================] 10 VUs 30s

    The test loops over all the game servers requesting the main index page thousands of times.

    Run The Test in Kubernetes

    Now load the test script into a ConfigMap and create a TestRun object to setup and run it:

    kubectl create configmap arkade-loadtest --from-file=./arkade_loadtest.js
    
    $ cat arkade_TestRun.yaml 
    apiVersion: k6.io/v1alpha1
    kind: TestRun
    metadata:
      name: arkade-testrun
    spec:
      parallelism: 2
      script:
        configMap:
          name: arkade-loadtest
          file: arkade_loadtest.js
      arguments: "--insecure-skip-tls-verify"
    
    $ kubectl apply -f arkade_TestRun.yaml
    testrun.k6.io/arkade-testrun created
    

    I had to disable TLS certificate verification to run it in the cluster because the runner pods don’t have access to the self signed certificate.

    Now monitor the test run:

    $ kubectl get jobs
    NAME STATUS COMPLETIONS DURATION AGE
    arkade-loadtest-1 Running 0/1 0s 0s
    arkade-loadtest-2 Running 0/1 0s 0s
    arkade-loadtest-initializer Complete 1/1 7s 7s

    $ kubectl get pods
    NAME READY STATUS RESTARTS AGE
    arkade-loadtest-1-j864z 1/1 Running 0 17s
    arkade-loadtest-2-t6r2v 1/1 Running 0 17s
    arkade-loadtest-initializer-r5pgt 0/1 Completed 0 24s
    arkade-loadtest-starter-pq2mh 0/1 Completed 0 13s

    And pull the results:

    $ kubectl logs arkade-loadtest-1-j864z

    █ TOTAL RESULTS

    HTTP
    http_req_duration..............: avg=5.6ms min=2.4ms med=4.02ms max=102.11ms p(90)=9.39ms p(95)=12.75ms
    { expected_response:true }...: avg=5.6ms min=2.4ms med=4.02ms max=102.11ms p(90)=9.39ms p(95)=12.75ms
    http_req_failed................: 0.00% 0 out of 2312
    http_reqs......................: 2312 74.683635/s

    EXECUTION
    iteration_duration.............: avg=1.12s min=1.05s med=1.07s max=1.62s p(90)=1.2s p(95)=1.25s
    iterations.....................: 136 4.393155/s
    vus............................: 5 min=0 max=5
    vus_max........................: 5 min=5 max=5

    NETWORK
    data_received..................: 13 MB 406 kB/s
    data_sent......................: 234 kB 7.6 kB/s

    Run The Load Test Every Hour

    Now let’s automate the test run so it goes every hour. I used a kubernetes CronJob to do that. The cronjob uses kubectl to delete/reapply the TestRun object on a schedule:

    $ cat k6_CronJob.yaml 
    apiVersion: batch/v1
    kind: CronJob
    metadata:
    name: arkade-loadtest-cron
    spec:
    schedule: "0 * * * *"
    concurrencyPolicy: Forbid
    jobTemplate:
    spec:
    template:
    spec:
    serviceAccount: k6
    containers:
    - name: kubectl
    image: bitnami/kubectl
    volumeMounts:
    - name: arkade-testrun
    mountPath: /tmp/
    command:
    - /bin/bash
    args:
    - -c
    - 'kubectl delete -f /tmp/arkade_TestRun.yaml; kubectl apply -f /tmp/arkade_TestRun.yaml'
    restartPolicy: OnFailure
    volumes:
    - name: arkade-testrun
    configMap:
    name: arkade-testrun

    The arkade-load-test CronJob depends on a ServiceAccount and two ConfigMaps. The k6 ServiceAccount gives the job permission to run kubectl to delete/apply on the testrun objects. One configmap is the test script contents (like above) and the other is the definition of the TestRun that was applied manually earlier.

    The ServiceAccount definition goes like this:

    $ kubectl --namespace $NAMESPACE apply -f k6_ServiceAccount.yaml
    $ cat k6_ServiceAccount.yaml
    ---
    apiVersion: rbac.authorization.k8s.io/v1
    kind: Role
    metadata:
    name: k6
    rules:
    - apiGroups:
    - k6.io
    resources:
    - testruns
    verbs:
    - create
    - delete
    - get
    - list
    - patch
    - update
    - watch
    ---
    kind: RoleBinding
    apiVersion: rbac.authorization.k8s.io/v1
    metadata:
    name: k6
    roleRef:
    kind: Role
    name: k6
    apiGroup: rbac.authorization.k8s.io
    subjects:
    - kind: ServiceAccount
    name: k6
    namespace: k6
    ---
    apiVersion: v1
    kind: ServiceAccount
    metadata:
    name: k6

    The ConfigMaps are created like this:

    $ kubectl --namespace $NAMESPACE create configmap arkade-loadtest --from-file=./arkade_loadtest.js

    $ kubectl --namespace $NAMESPACE create configmap arkade-testrun --from-file=./arkade_TestRun.yaml

    Test The CronJob

    Rather than wait for the top of the hour for the CronJob to fire – just schedule the job manually right now:

    $ kubectl -n k6 delete job testrun
    job.batch "testrun" deleted

    $ kubectl -n k6 create job --from=cronjob/arkade-loadtest-cron testrun
    job.batch/testrun created

    Then monitor the run:

    $ kubectl -n k6 get jobs
    NAME STATUS COMPLETIONS DURATION AGE
    arkade-loadtest-cron-29286600 Complete 1/1 3m38s 26m
    arkade-testrun-1 Running 0/1 16s 16s
    arkade-testrun-2 Running 0/1 16s 16s
    arkade-testrun-initializer Complete 1/1 6s 21s
    arkade-testrun-starter Complete 1/1 8s 12s
    testrun Complete 1/1 7s 25s

    then pull the results:

    $ kubectl -n k6 logs arkade-testrun-1-ft84q 


    █ TOTAL RESULTS

    HTTP
    http_req_duration..............: avg=4.49ms min=2.54ms med=3.6ms max=50.77ms p(90)=6.38ms p(95)=9.28ms
    { expected_response:true }...: avg=4.49ms min=2.54ms med=3.6ms max=50.77ms p(90)=6.38ms p(95)=9.28ms
    http_req_failed................: 0.00% 0 out of 2380
    http_reqs......................: 2380 76.901145/s

    EXECUTION
    iteration_duration.............: avg=1.1s min=1.05s med=1.07s max=1.61s p(90)=1.14s p(95)=1.15s
    iterations.....................: 140 4.523597/s
    vus............................: 2 min=0 max=5
    vus_max........................: 5 min=5 max=5

    NETWORK
    data_received..................: 13 MB 418 kB/s
    data_sent......................: 240 kB 7.8 kB/s


    $ kubectl -n k6 logs arkade-testrun-2-sgc4v


    █ TOTAL RESULTS

    HTTP
    http_req_duration..............: avg=4.68ms min=2.66ms med=3.61ms max=51.45ms p(90)=6.9ms p(95)=9.37ms
    { expected_response:true }...: avg=4.68ms min=2.66ms med=3.61ms max=51.45ms p(90)=6.9ms p(95)=9.37ms
    http_req_failed................: 0.00% 0 out of 2329
    http_reqs......................: 2329 75.377741/s

    EXECUTION
    iteration_duration.............: avg=1.1s min=1.05s med=1.07s max=1.65s p(90)=1.15s p(95)=1.25s
    iterations.....................: 137 4.433985/s
    vus............................: 2 min=0 max=5
    vus_max........................: 5 min=5 max=5

    NETWORK
    data_received..................: 13 MB 410 kB/s
    data_sent......................: 236 kB 7.6 kB/s

    I’ll wait for the hour to tick off and check the test results again. A likely next step would be to review my grafana monitoring setup through a test run and also look into pulling the test results over to my dashboards.

    it works! I changed the tests to 10 minutes duration every half hour. Nice sharp traffic peaks!

    -Sandy

  • Grafana Monitoring for the Arkade Cluster

    Lets take a light bubbly kubernetes project like arkade retro gaming and ramp up the fun by adding monitoring! Bleck. Seriously though, I’d like to learn more about monitoring a kubernetes cluster so lets get started. Today (erm this week) I’ll build that into my home cluster.

    Setup

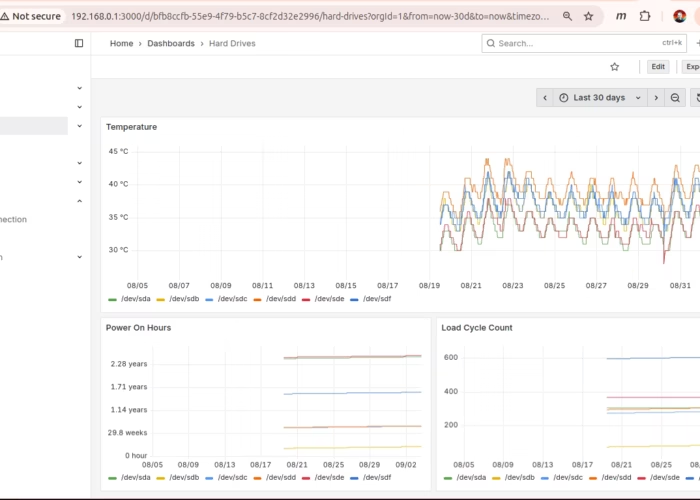
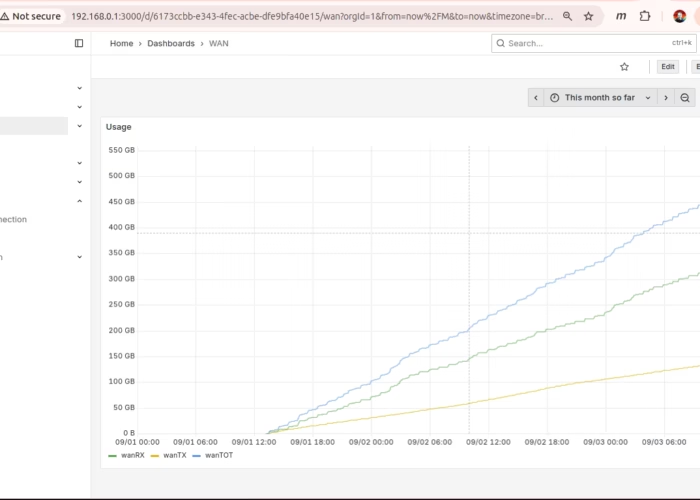
    I recently setup the grafana/prometheus combination to monitor my main server. The server runs pretty idle, and never really gets overloaded. I do want to monitor drive temps on the server RAID. I also want to monitor network usage of the WAN NIC just to compare with the usage report from my ISP.


    To get the network monitor, I setup a custom vnstat -> telegraf -> prometheus chain which was sort of interesting (but *really* not required for my cluster – so skip over if you want). The kubernetes content you crave continues below

    vnstat

    $ sudo apt install vnstat 
    $ systemctl enable vnstat 
    $ systemctl start vnstat
    

    I played with vnstat commands for a while to reduce the number of interfaces it was tracking:

    $ sudo vnstat --remove --iface gar0 --force
    $ sudo vnstat --add --iface wan 
    $ sudo vnstat --add --iface lan 
    ...
    $ vnstat wan -m 
    
     wan  /  monthly
    
            month        rx      |     tx      |    total    |   avg. rate
         ------------------------+-------------+-------------+---------------
           2025-08     99.15 GiB |   23.86 GiB |  123.01 GiB |  394.52 kbit/s
           2025-09    394.20 GiB |  169.98 GiB |  564.18 GiB |   21.31 Mbit/s
         ------------------------+-------------+-------------+---------------
         estimated      4.39 TiB |    1.89 TiB |    6.28 TiB |
    

    Let that run for a while and soon you can dump traffic stats for the various NICs in the linux box. Side note my linux server is my router so I’ve got my interface adapters renamed ‘wan’, ‘lan’, ‘wifi’ etc. depending on what they are connected to. ‘wan’ is external traffic to the modem. ‘lan’ is all internal traffic (lan is a bridge). ‘wifi’ goes off to my wireless access point (wifi lives in the lan bridge).

    telegraf

    Now setup telegraf to scrape the vnstat reports and feed them to prometheus.

    $ sudo apt install telegraf
    $ cat /etc/telegraf/telegraf.d/vnstat.conf
    [[inputs.exec]]
    commands = ["/usr/local/bin/vnstat-telegraf.sh"]
    timeout = "5s"
    data_format = "influx"
    $ cat /usr/local/bin/vnstat-telegraf.sh
    #!/bin/bash
    for IFACE in wan lan wifi fam off bond0
    do
    vnstat --json | jq -r --arg iface "$IFACE" '
    .interfaces[] | select(.name==$iface) |
    .traffic.total as $total |
    "vnstat,interface=\($iface) rx_bytes=\($total.rx),tx_bytes=\($total.tx)"
    '
    done
    $ sudo systemctl enable telegraf
    $ sudo systemctl start telegraf

    then check the config with a quick curl:

    $ curl --silent localhost:9273/metrics | grep wan
    vnstat_rx_bytes{host="www.hobosuit.com",interface="wan"} 5.34410207039e+11
    vnstat_tx_bytes{host="www.hobosuit.com",interface="wan"} 2.10284865396e+11

    prometheus

    Now install prometheus and hookup telegraf:

    $ sudo apt install prometheus 
    $ tail /etc/prometheus/prometheus.yml

    - job_name: node
    # If prometheus-node-exporter is installed, grab stats about the local
    # machine by default.
    static_configs:
    - targets: ['localhost:9100']

    - job_name: 'telegraf-vnstat'
    static_configs:
    - targets: ['localhost:9273']
    $ sudo systemctl restart prometheus

    The prometheus is configured with the node exporter which includes the drive temp data I’m looking for and I’ve added the telegraf-nvstat config to put out the network usage stats. Check the node exporter with curl like this:

    curl --silent localhost:9100/metrics | grep smartmon_temperature_celsius_raw
    # HELP smartmon_temperature_celsius_raw_value SMART metric temperature_celsius_raw_value
    # TYPE smartmon_temperature_celsius_raw_value gauge
    smartmon_temperature_celsius_raw_value{disk="/dev/sda",smart_id="194",type="sat"} 35
    smartmon_temperature_celsius_raw_value{disk="/dev/sdb",smart_id="194",type="sat"} 40
    smartmon_temperature_celsius_raw_value{disk="/dev/sdc",smart_id="194",type="sat"} 41
    smartmon_temperature_celsius_raw_value{disk="/dev/sdd",smart_id="194",type="sat"} 42
    smartmon_temperature_celsius_raw_value{disk="/dev/sde",smart_id="194",type="sat"} 36
    smartmon_temperature_celsius_raw_value{disk="/dev/sdf",smart_id="194",type="sat"} 40

    Grafana

    I setup grafana using docker-compose :

    $ cat docker-compose.yaml 
    version: '3.8'
    
    services:
      influxdb:
        image: influxdb:latest
        container_name: influxdb
        ports:
          - "8086:8086"
        volumes:
          - /grafana/influxdb-storage:/var/lib/influxdb2
        environment:
          - DOCKER_INFLUXDB_INIT_MODE=setup
          - DOCKER_INFLUXDB_INIT_USERNAME=admin
          - DOCKER_INFLUXDB_INIT_PASSWORD=thatsmypurse
          - DOCKER_INFLUXDB_INIT_ORG=my_org
          - DOCKER_INFLUXDB_INIT_BUCKET=my_bucket
          - DOCKER_INFLUXDB_INIT_ADMIN_TOKEN=idontknowyou
    
      grafana:
        image: grafana/grafana:latest
        container_name: grafana
        ports:
          - "3000:3000"
        volumes:
          - /grafana/grafana-storage:/var/lib/grafana
        environment:
          - GF_SECURITY_ADMIN_USER=thatsmypurse
          - GF_SECURITY_ADMIN_PASSWORD=idontknowyou
        depends_on:
          - influxdb
    
    networks:
      default:
        driver: bridge
        driver_opts:
          com.docker.network.bridge.name: br-grafana
        ipam:
          config:
            - subnet: 172.27.0.0/24
    

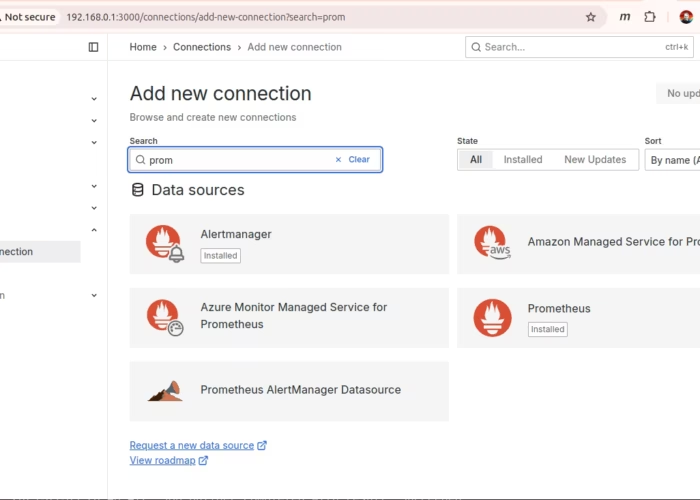
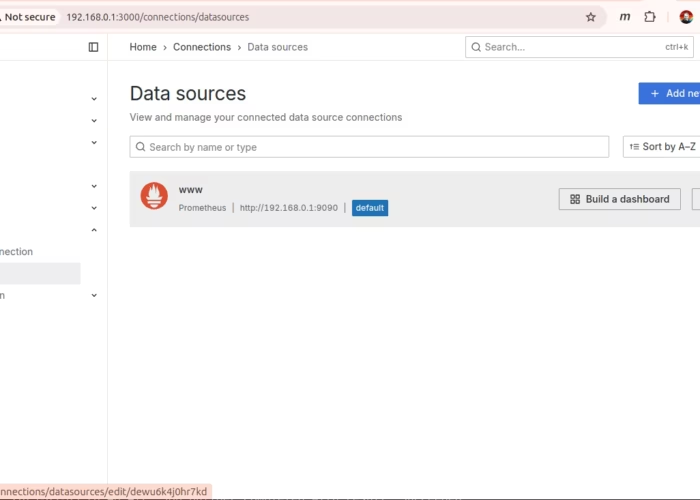
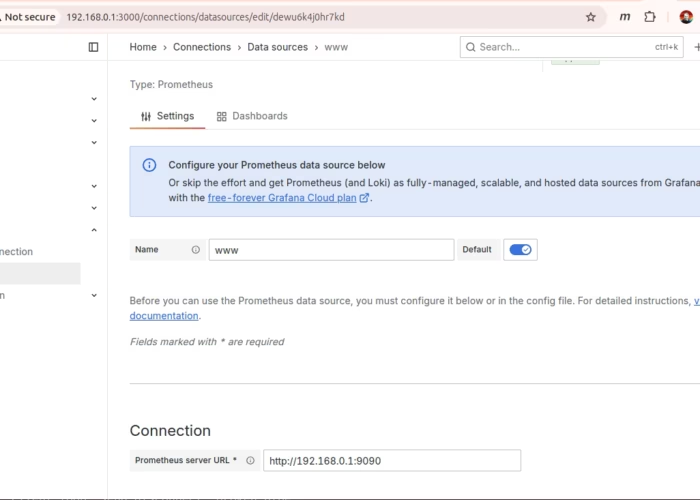
    Set a DataSource

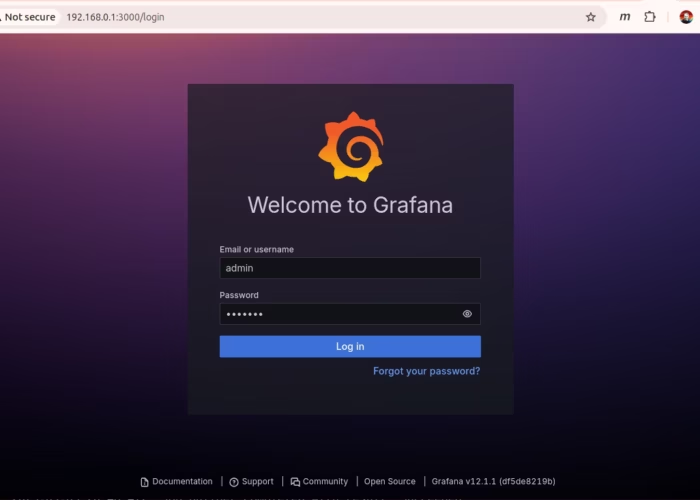
    Finally, I can log in to grafana, setup a datasource and build some dashboards

    Wait What?

    I can’t build all that that nonsense every time I want to setup a node in a kubernetes cluster. Plus I don’t really need the wan usage stuff. Luckily ‘there’s a helm chart for that’. prometheus-community/kube-prometheus-stack puts the prometheus node exporter on each node (as a daemonset), and takes care of starting grafana with lots of nice preconfigured dashboards.

    Dump the values.yaml

    It’s a big complicated chart, so I found it helpful to dump the values.yaml file to study.

    helm repo add prometheus-community https://prometheus-community.github.io/helm-charts
    helm repo update
    helm show values prometheus-community/kube-prometheus-stack > prom_values.yaml

    Ultimately I came up with this script to install the chart into the mon namespace:

    #!/bin/bash

    . ./functions.sh

    NAMESPACE=mon

    info "Setup prometheus community helm repo"
    helm repo add prometheus-community https://prometheus-community.github.io/helm-charts
    helm repo update

    info "Install prometheus-community chart into '$NAMESPACE' namespace"
    helm upgrade --install prom prometheus-community/kube-prometheus-stack \
    --namespace $NAMESPACE \
    --create-namespace \
    --set grafana.adminUser=${GRAFANA_ADMIN} \
    --set grafana.adminPassword=${GRAFANA_PASSWORD} \
    --set grafana.persistence.type=pvc \
    --set grafana.persistence.enabled=true \
    --set grafana.persistence.storageClass=longhorn \
    --set "grafana.persistence.accessModes={ReadWriteMany}" \
    --set grafana.persistence.size=8Gi \
    --set grafana.resources.requests.memory=512Mi \
    --set prometheus.prometheusSpec.storageSpec.volumeClaimTemplate.spec.storageClassName=longhorn \
    --set "prometheus.prometheusSpec.storageSpec.volumeClaimTemplate.spec.accessModes={ReadWriteMany}" \
    --set prometheus.prometheusSpec.storageSpec.volumeClaimTemplate.spec.resources.requests.storage=4Gi \
    --set prometheus.prometheusSpec.retention=14d \
    --set prometheus.prometheusSpec.retentionSize=8GiB \
    --set prometheus.prometheusSpec.resources.requests.memory=2Gi

    info "Wait for pods to come up in '$NAMESPACE' namespace"
    pod_wait $NAMESPACE

    info "Setup cert-manager for the grafana server"
    kubectl apply -f prom_Certificate.yaml

    info "Setup Traefik ingress route for grafana"
    kubectl apply -f prom_IngressRoute.yaml

    info "Wait for https://grafana to be available"
    # grafana redirects to the login screen so a status code of 302 means it's ready
    https_wait https://grafana/login '200|302'

    I added persistence using longhorn volumes and setup my usual self-signed certificate to secure the traefik IngressRoute to the grafana UI. Here’s the other bits and pieces of yaml:

     cat prom_Certificate.yaml 
    apiVersion: cert-manager.io/v1
    kind: Certificate
    metadata:
    name: prom-grafana
    namespace: mon
    spec:
    secretName: prom-grafana-cert-secret # <=== Name of secret where the generated certificate will be stored.
    dnsNames:
    - "grafana"
    issuerRef:
    name: hobo-intermediate-ca1-issuer
    kind: ClusterIssuer

    $ cat prom_IngressRoute.yaml
    apiVersion: traefik.io/v1alpha1
    kind: IngressRoute
    metadata:
    name: grafana
    namespace: mon
    annotations:
    cert-manager.io/cluster-issuer: hobo-intermediate-ca1-issuer
    cert-manager.io/common-name: grafana
    spec:
    entryPoints:
    - websecure
    routes:
    - kind: Rule
    match: Host(`grafana`)
    priority: 10
    services:
    - name: prom-grafana
    port: 80
    tls:
    secretName: prom-grafana-cert-secret

    ‘Monitoring’ ain’t easy

    Plus/minus some trial and error I adjusted my cluster setup scripts to bring up the usual pieces plus this new monitoring chunk (prom.sh) is the new bit:

    $ cat setup.sh 
    #!/bin/bash

    . ./functions.sh
    ./cert-manager.sh
    ./argocd.sh

    kubectl create ns games
    ./longhorn.sh

    ./prom.sh

    … and then one of the nodes went catatonic – he’s dead Jim.

    Monitoring is Expensive

    No shock there there’s no free lunch with cluster monitoring. At the very least, you have to dedicate some hardware. In this case, my little cluster just couldn’t handle the memory requirements of grafana / prometheus. The memory foot-print in this cluster is 4GB in the control plane and 2GB in each node. I fixed it by digging out a pi5 8GB that I just bought and adding it as a node – so with the single board computer and accessories, monitoring will cost about $150.

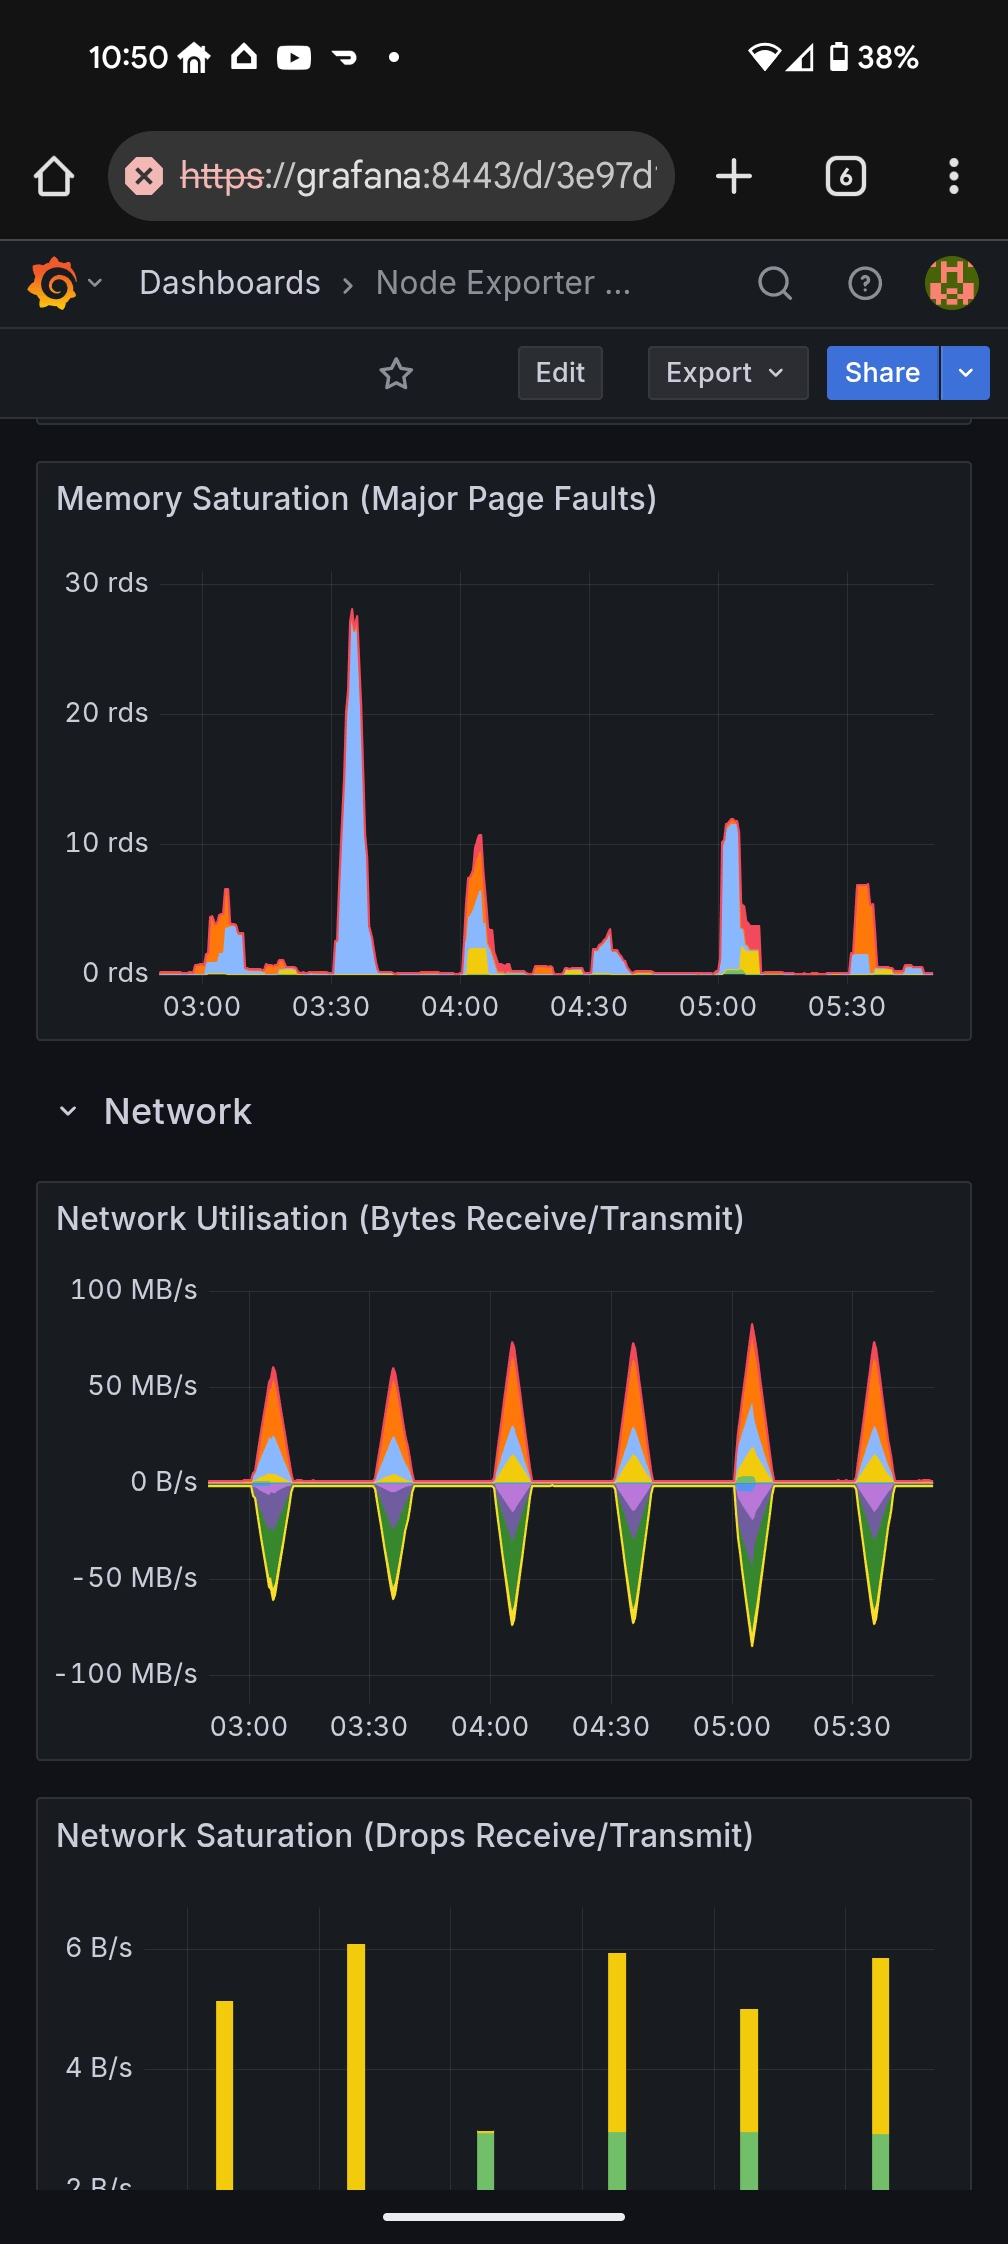
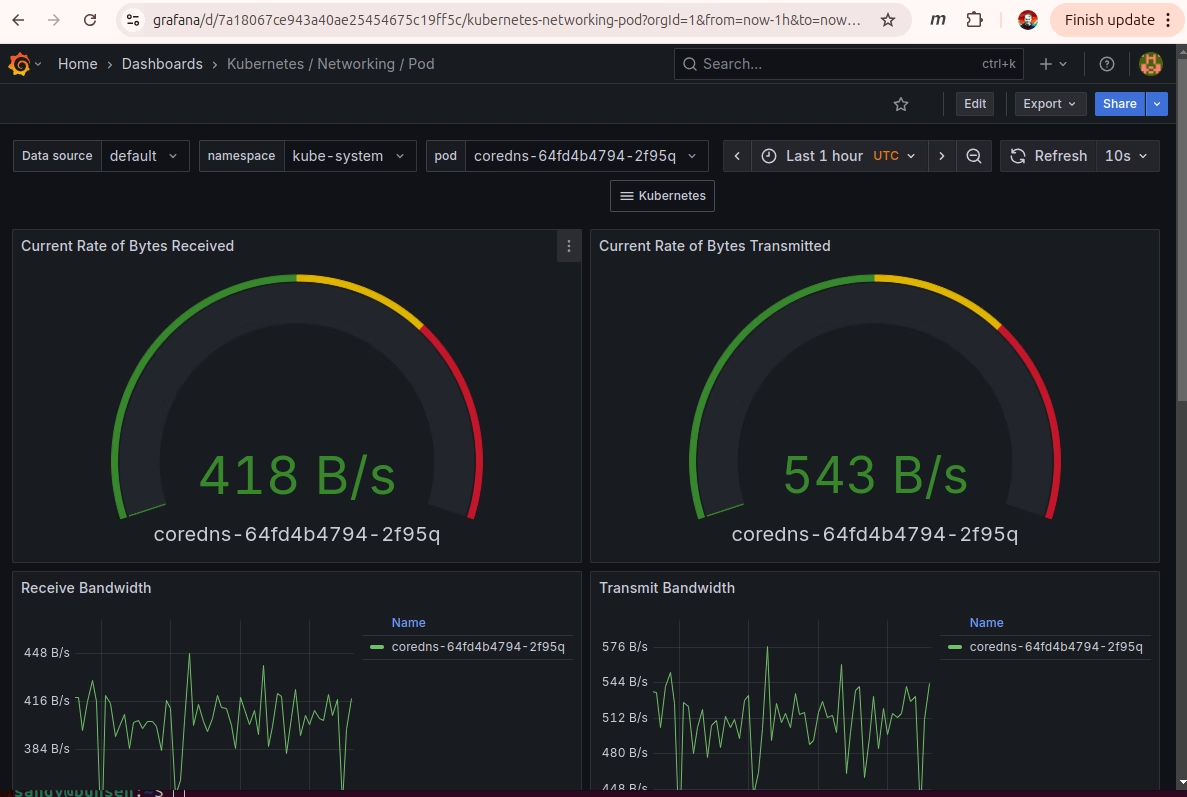
    Finally Cluster Monitoring

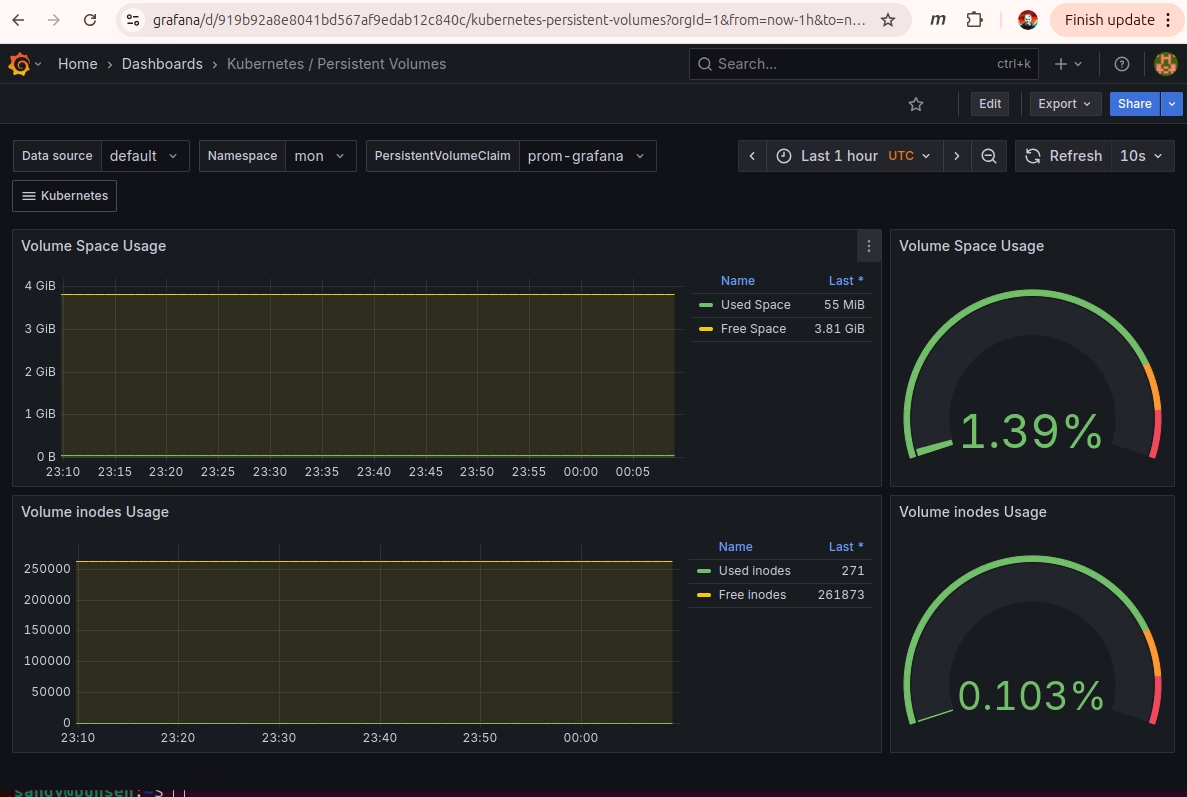
    Pretty. When it’s not crashing my main workloads. This gives me a start on learning to love monitoring and maybe even alerting.

    A late add to the setup was to add a model label on each node. The Pi5 computers have more RAM – so I set affinity for the larger deployments to make things run smoother. The updated helm install command looked like this:

    helm upgrade --install prom prometheus-community/kube-prometheus-stack \
    --namespace $NAMESPACE \
    --create-namespace \
    --set grafana.adminUser=${GRAFANA_ADMIN} \
    --set grafana.adminPassword=${GRAFANA_PASSWORD} \
    --set grafana.persistence.type=pvc \
    --set grafana.persistence.enabled=true \
    --set grafana.persistence.storageClass=longhorn \
    --set "grafana.persistence.accessModes={ReadWriteMany}" \
    --set grafana.persistence.size=8Gi \
    --set grafana.resources.requests.memory=512Mi \
    --set-json 'grafana.affinity={"nodeAffinity":{"preferredDuringSchedulingIgnoredDuringExecution":[{"weight":100,"preference":{"matchExpressions":[{"key":"model","operator":"In","values":["Pi5"]}]}}]}}' \
    --set prometheus.prometheusSpec.storageSpec.volumeClaimTemplate.spec.storageClassName=longhorn \
    --set "prometheus.prometheusSpec.storageSpec.volumeClaimTemplate.spec.accessModes={ReadWriteMany}" \
    --set prometheus.prometheusSpec.storageSpec.volumeClaimTemplate.spec.resources.requests.storage=4Gi \
    --set prometheus.prometheusSpec.retention=14d \
    --set prometheus.prometheusSpec.retentionSize=8GiB \
    --set prometheus.prometheusSpec.resources.requests.memory=2Gi \
    --set-json 'prometheus.prometheusSpec.affinity={"nodeAffinity":{"preferredDuringSchedulingIgnoredDuringExecution":[{"weight":100,"preference":{"matchExpressions":[{"key":"model","operator":"In","values":["Pi5"]}]}}]}}'

    -Sandy

  • Game Art

    I was a kid in the 80s and I’ve got a real soft spot for physical video games in cabinets. Aside from the game, there’s big chonky buttons, and glowing marquee art. 10 year old me was already very well acquainted with the concept of “coin return slots”. Finding a quarter in a coin return could make your whole week in 1980. The first game I ever came across was probably a PacMan in the Quinte Mall (probably pretty close to the Sneaky Pete’s)1.

    MAME Bezel Art

    I didn’t have retropie running very long before I found the bezel pack. Retro video games were displayed on 4:3 aspect ratio CRT monitors (picture Defender, or Joust). Some games turned the monitor sideways so basically 3:4 (think Centiped or PacMan). Other games (like the Donkey Kong Jr cocktail game) would flip the screen so that two players could sit on either side of the game.

    CRT monitors also had a prominent curved front so no matter how tight you fit the monitor in the cabinet there was going to be a gap. That’s where the bezel comes in to cover the gap and make the CRT look flatter. Nothing on the front of a video game goes undecorated so there was usually some bezel art (often with instructions and pricing). Then a flat piece of glass on top.

    Modern displays are wider aspect than CRTs (usually 16:9 or 16:10) so there’s some screen real estate on edges of the display for some artwork. Bezel art is a 16:9 aspect ratio (the ones I use are 1920×1080) image (png) with a transparent hole in the middle. The hole, centered in the screen is either 810×1080 or 1440×1080 depending on the expected orientation of the game. So there’s 555px or 240px on either side of the game for artwork.

    Marquee Art

    Most games also had a marquee. A translucent piece of backlit plexiglass on the top of the machine. The dimensions of the marquee art are less critical. I usually expect an aspect ratio of 32:9. On my retropie setup I display the marquee on the bottom half of a second monitor mounted above the main game monitor.

    Arkade Layout

    The Emulator object is passed a canvas reference where the game is drawn. When I first created index.html pages for the games, I just used the example code so they look pretty plain. I’d like to add the marquee and bezel art around the MAME canvas sort of like this:

    A big goal for this change was to come up with a way to do the layout without touching the loader.js code – ultimately that decision probably made my job easier. I had to learn some style sheet tricks, but didn’t have to get into someone’s javascript code and figure out how to paint on canvases.

    HTML For The Layout

    This is the HTML to represent the layout:

        <div id="wrapper">
    <img id="marquee" src="marquee.png" alt="Marquee">
    <img id="bezel" src="bezel.png" alt="Bezel">
    <div id="emularity">
    <canvas id="canvas" style="margin: 0; padding: 0"></canvas>
    </div>
    </div>

    CSS Tricks

    The normal layout for those entities would have the game canvas below the bezel, when they really need to overlap. I did that with CSS:

        <style>
    html, body {
    padding: 0; margin: 0;
    width: 100vw; height: 100vh;
    }
    #wrapper {
    position: absolute;
    width: fit-content;
    background-color: black;
    padding: 0; margin: 0;
    width: 100vw; height: 100vh;
    }
    #marquee {
    width: 100%;
    aspect-ratio: 32 / 9;
    opacity: 0.8;
    padding: 0; margin: 0;
    }
    #bezel {
    position: relative;
    pointer-events: none;
    z-index: 2;
    width: 100%;
    aspect-ratio: 16 / 9;
    opacity: 0.8;
    padding: 0; margin: 0;
    }
    #emularity {
    position: relative;
    z-index: 1;
    padding: 0; margin: 0;
    }
    </style>

    There’s quite a lot going on there. The bezel art and emularity div are relative position. That lets me position them dynamically (see below) but also gives me a z-index (bezel on top with canvas below). The user input needs to pass through the bezel and get to the canvas (so pointer-events: none). In all this, I’m trying to maximize the display so I zero all the padding and margins. The wrapper paints the background black and I set a little opacity on the images – which helped me troubleshoot the overlap – but now I just like the way it looks.

    Game Scale JS

    Then there’s a big update to the example script section to scale everything as the emulator is starting up:

        <script type="text/javascript">
    function game_scale(loader, canvas) {
    var wrapper = document.querySelector("#wrapper");
    var marquee = document.querySelector("#marquee");
    var bezel = document.querySelector("#bezel");
    var emularity = document.querySelector("#emularity");
    var rotation = 0;
    var rotated = ( rotation == 90 || rotation == 270 );

    // The Bezel art is 16:9 aspect-ration and has either a 4:3 (horizontal game) or 3:4 (vertical game)
    // transparent hole in the middle. The height of the game should be the same as the height of the hole
    // (which is just the height of the art).
    // The width of the hole depends on the aspect-ratio
    // - for e.g. centiped in a 1920x1080 bezel art the height is just 1080 and the width is 3/4*1080
    // The actual resolution for centiped doesn't match the aspect-ratio of the gap so the game will be a
    // little bit streched to fit the hole...
    var game_height = bezel.height;
    var game_width = Math.trunc(4.0/3.0 * game_height);
    if ( rotated ) {
    game_height = bezel.height;
    game_width = Math.trunc(3.0/4.0 * game_height);
    }

    // Tell the loader to draw the game in a canvas that is the computed width x height
    // and disable any scaling since those width x height values are computed to fit
    // perfectly.
    loader.nativeResolution.width = game_width;
    loader.nativeResolution.height = game_height;
    loader.scale = 1.0;

    // The game canvas is inside a div called "emularity".
    // Position the div so that it appears in the hole in the bezel art.
    // The bezel and emularity are 'position: relative' so that they can overlap *and*
    // the emularity div is declared second.
    // Set the emularity top value "-bezel.height" so that it moves from below the bezel
    // to overlapping.
    // The left edge the emularity div is the middle of the bezel minus half the game_width
    //
    // The wrapper div provides the black background stretch that out to fit the marquee and bezel
    emularity.style.height = game_height;
    emularity.style.width = game_width;
    emularity.style.top = -bezel.height;
    emularity.style.left = Math.trunc((bezel.width - game_width)/2.0);
    wrapper.style.height = marquee.height + bezel.height;
    wrapper.style.width = marquee.width;

    emulator.start({ waitAfterDownloading: false });
    }
    var nr = {width: 352, height: 240 };
    var canvas = document.querySelector("#canvas");
    var loader = new MAMELoader(MAMELoader.driver("robby"),
    MAMELoader.nativeResolution(nr.width, nr.height),
    MAMELoader.scale(1.0),
    MAMELoader.emulatorWASM("mameastrocde.wasm"),
    MAMELoader.emulatorJS("mameastrocde.js"),
    MAMELoader.extraArgs(['-verbose']),
    MAMELoader.mountFile("robby.zip",
    MAMELoader.fetchFile("Game File",
    "/roms/robby.zip")));

    var emulator = new Emulator(canvas, null, loader);
    window.addEventListener('onload', game_scale(loader, canvas));
    window.addEventListener('resize', function() { location.reload(true); });

    There’s a bunch of “magic” hard-codes in the script above that are actually provided by the MAME meta database. During the build each game has a json summary of it’s meta data the one for robby looks like this:

    sandy@www:~/arkade$ more build/robby/robby.json 
    {
    "name": "robby",
    "description": "The Adventures of Robby Roto!",
    "sourcefile": "midway/astrocde.cpp",
    "sourcestub": "astrocde",
    "year": "1981",
    "manufacturer": "Dave Nutting Associates / Bally Midway",
    "players": "2",
    "type": "joy",
    "buttons": "1",
    "ways": "4",
    "coins": "3",
    "channels": "1",
    "rotate": "0",
    "height": "240",
    "width": "352"
    }

    MAME can tell you things like the rotation angle of the game, it’s native resolution (which I basically throw-out above). Ultimately the best way to code this up was to decide if the game is 4:3 or 3:4, figure out what the bezel art has been scaled to and then make the canvas the size of the hole in the bezel (and jam the scale to 1). The resize listener was a compromise, because I stayed out of the loader code, I can’t really resize the canvas on the fly – the emulator really needs to be restarted to get a new size. I force a reload on resize to recalculate the new canvas size(this restarts the emulator – but who’s really resizing the window mid game).

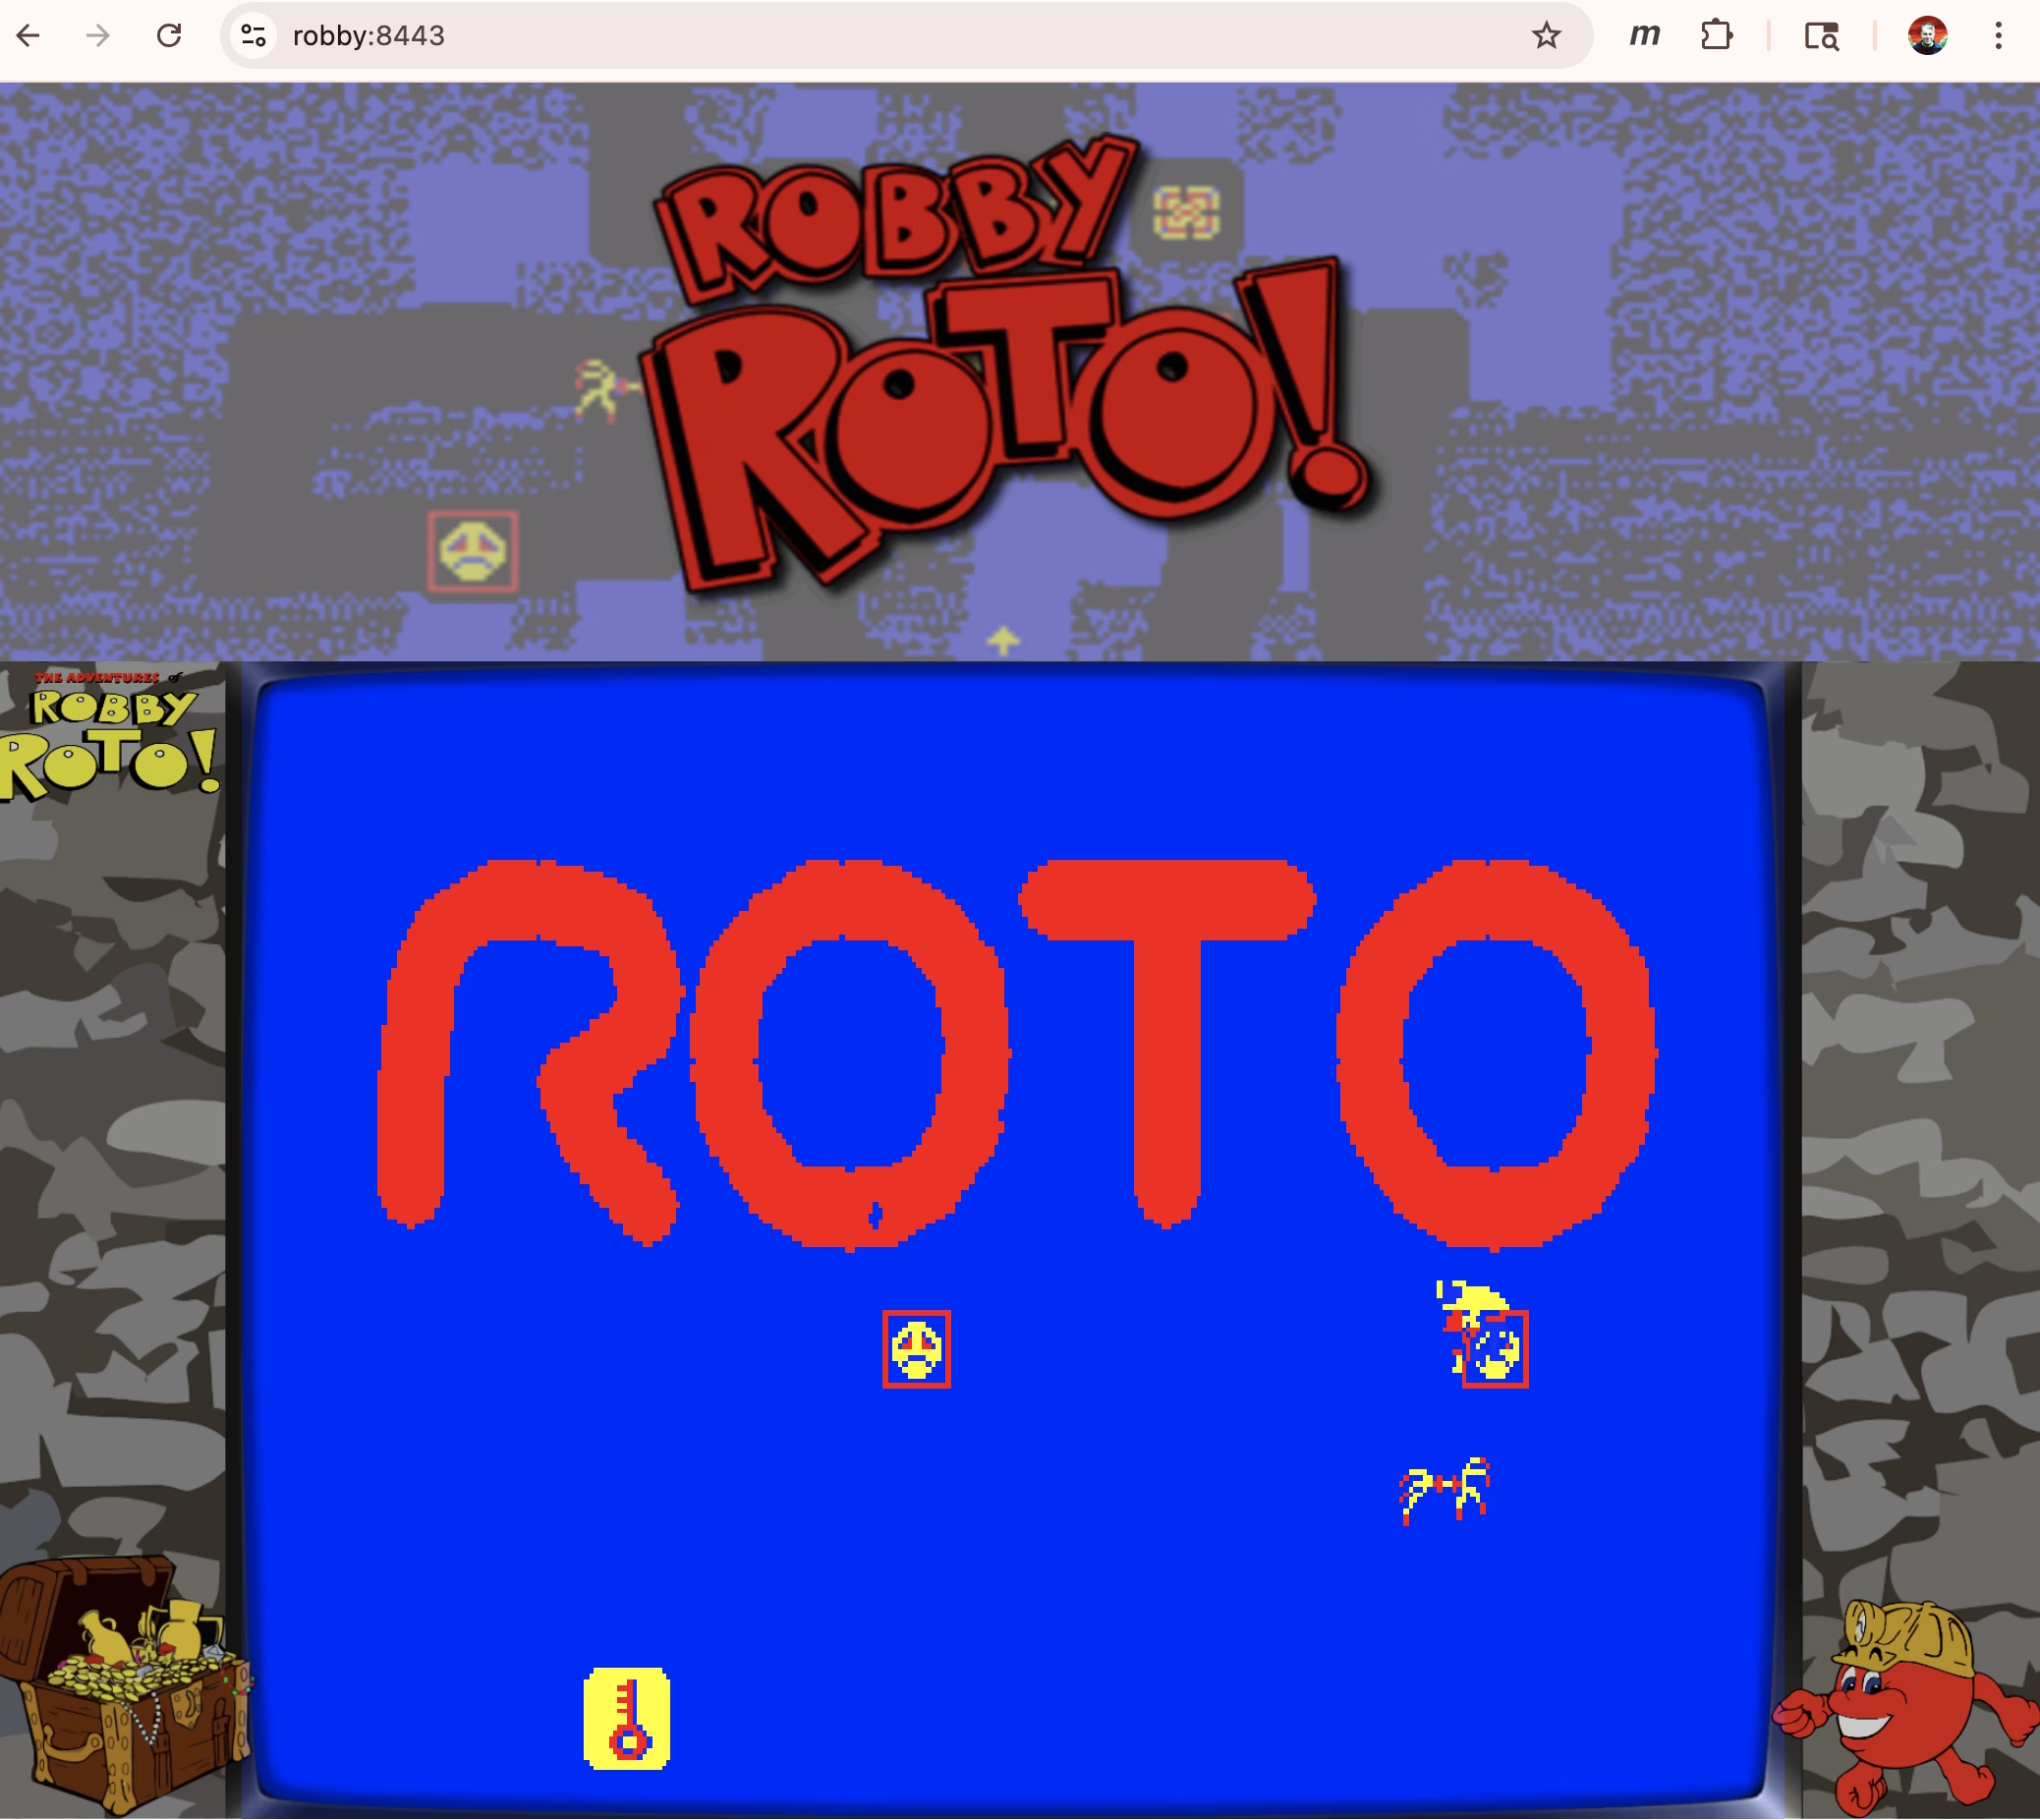
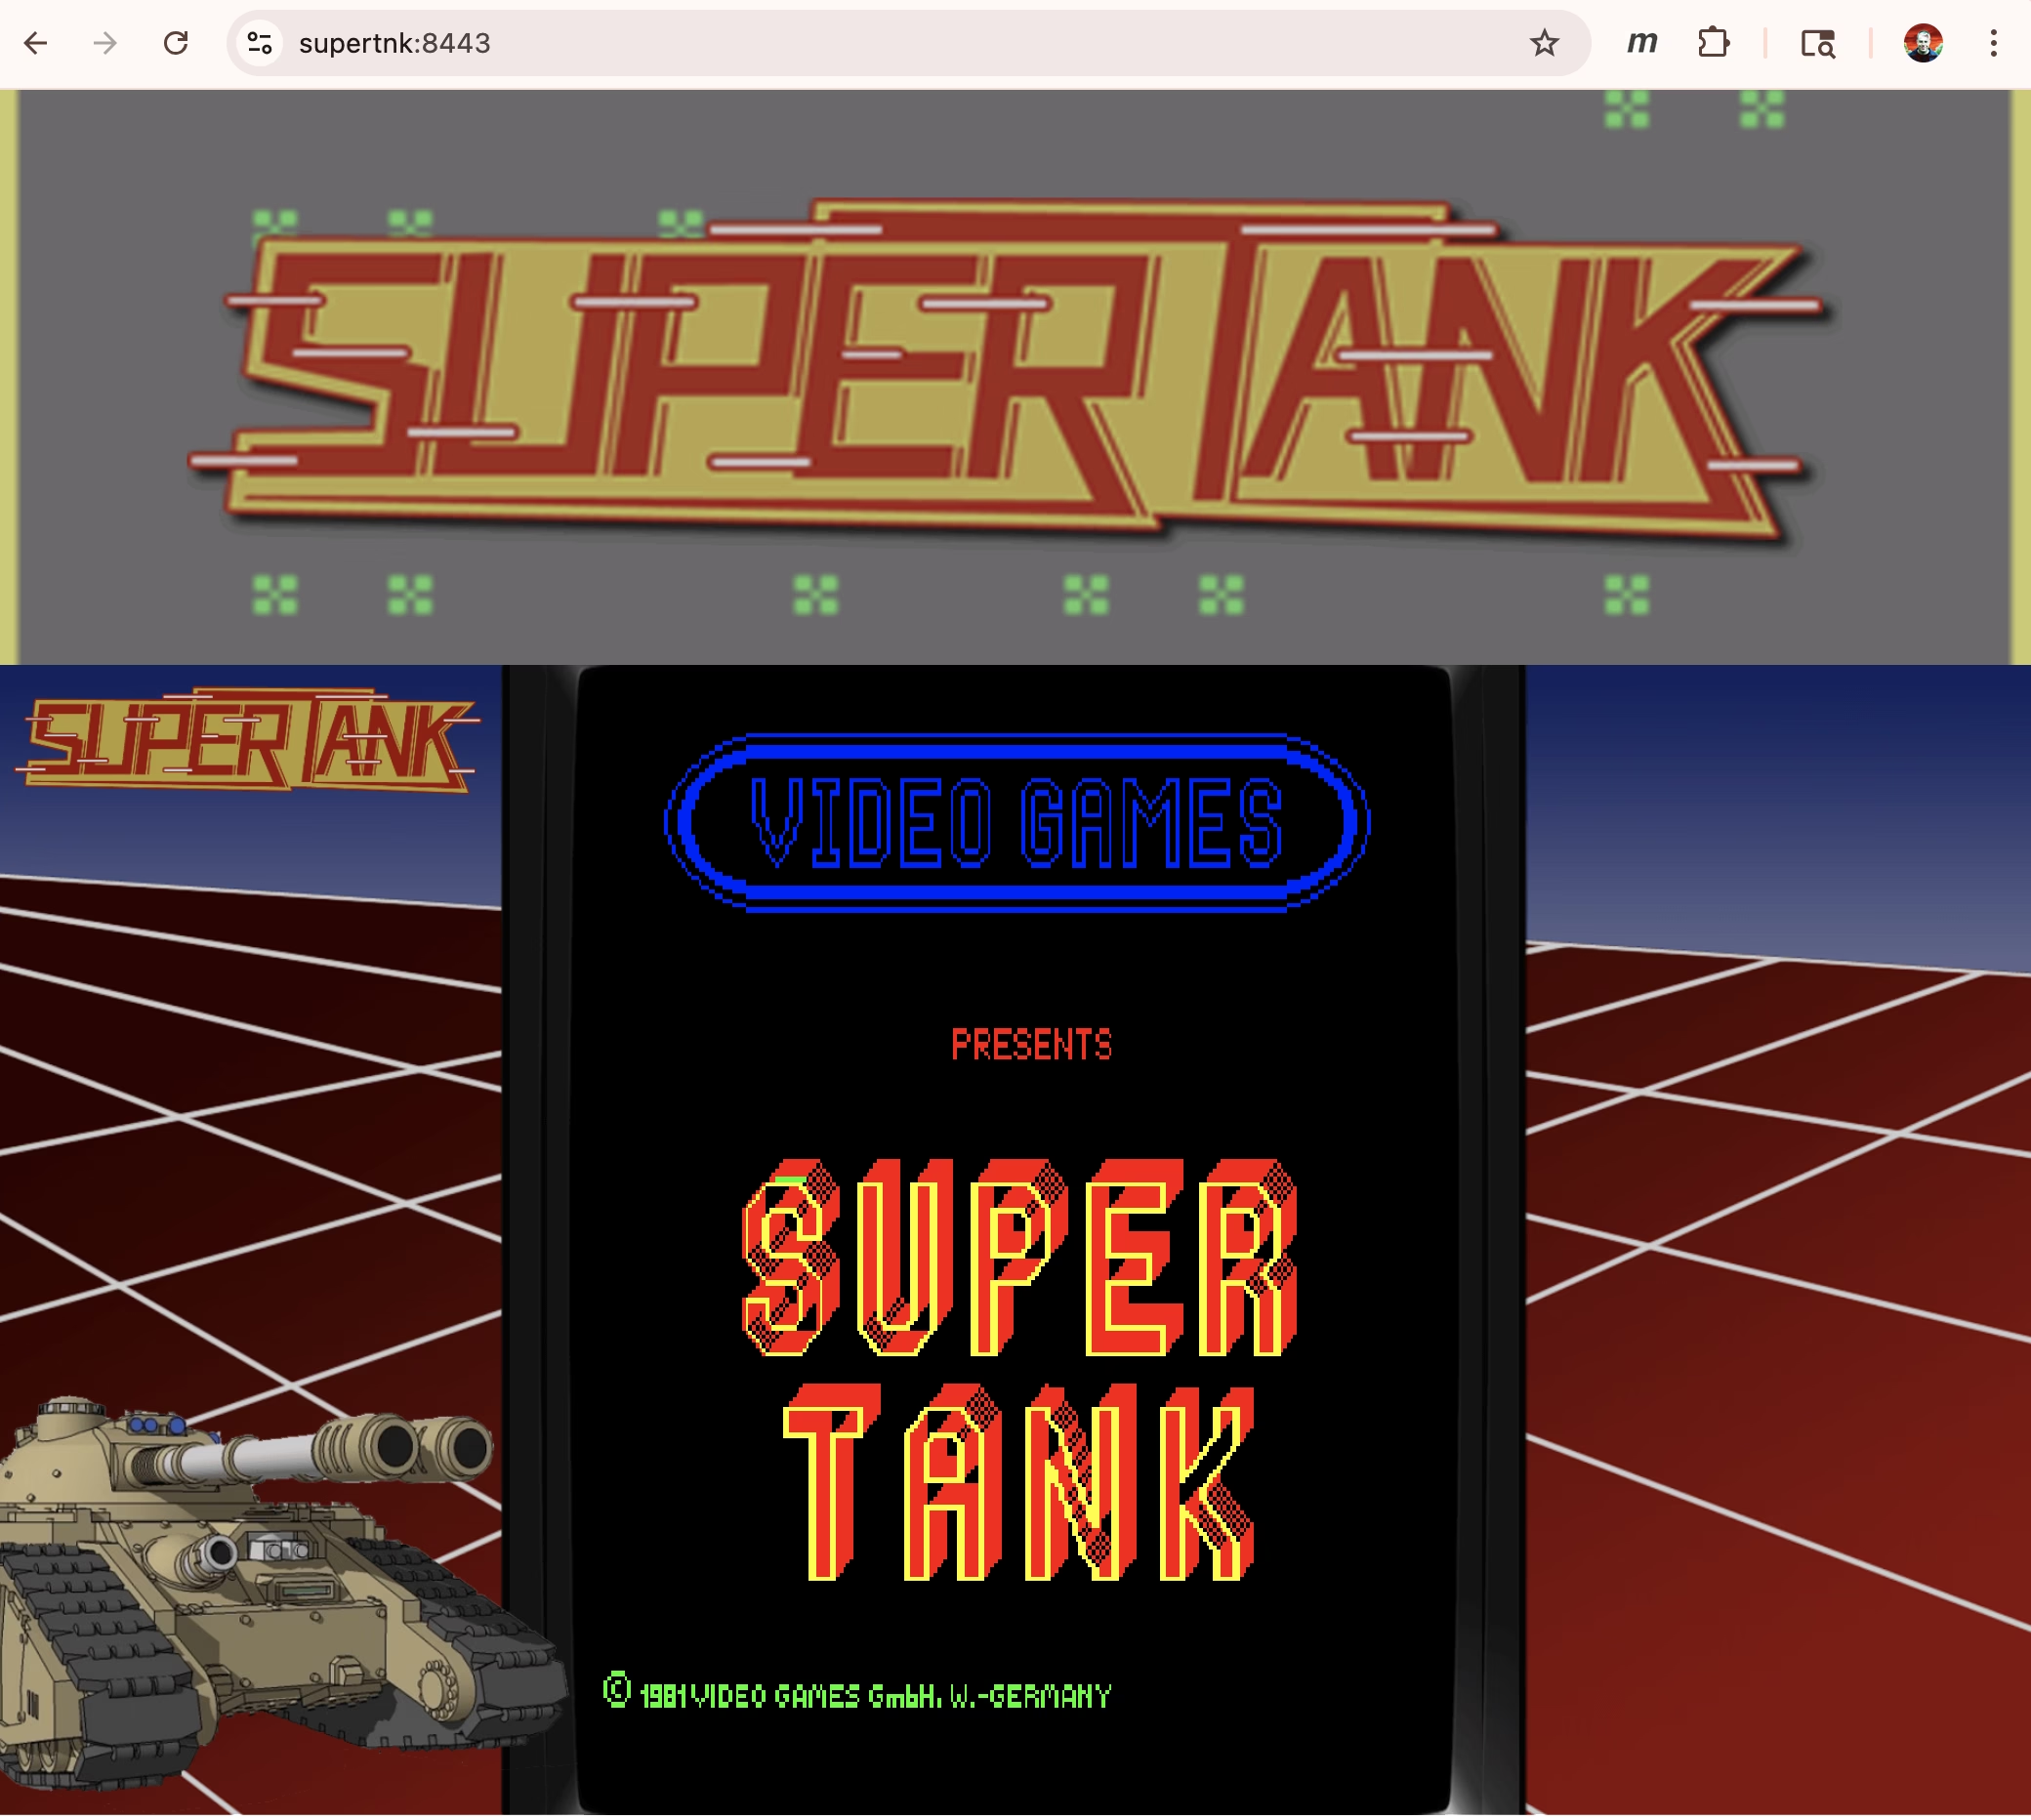
    The end result looks like these:

    -Sandy

    1. There was a Battlezone over by the grocery store, and a Missle Command somewhere in there too. Anyway enough “old man reminiscing to clouds”… â†Šī¸Ž
  • Tired of Certificate Warnings

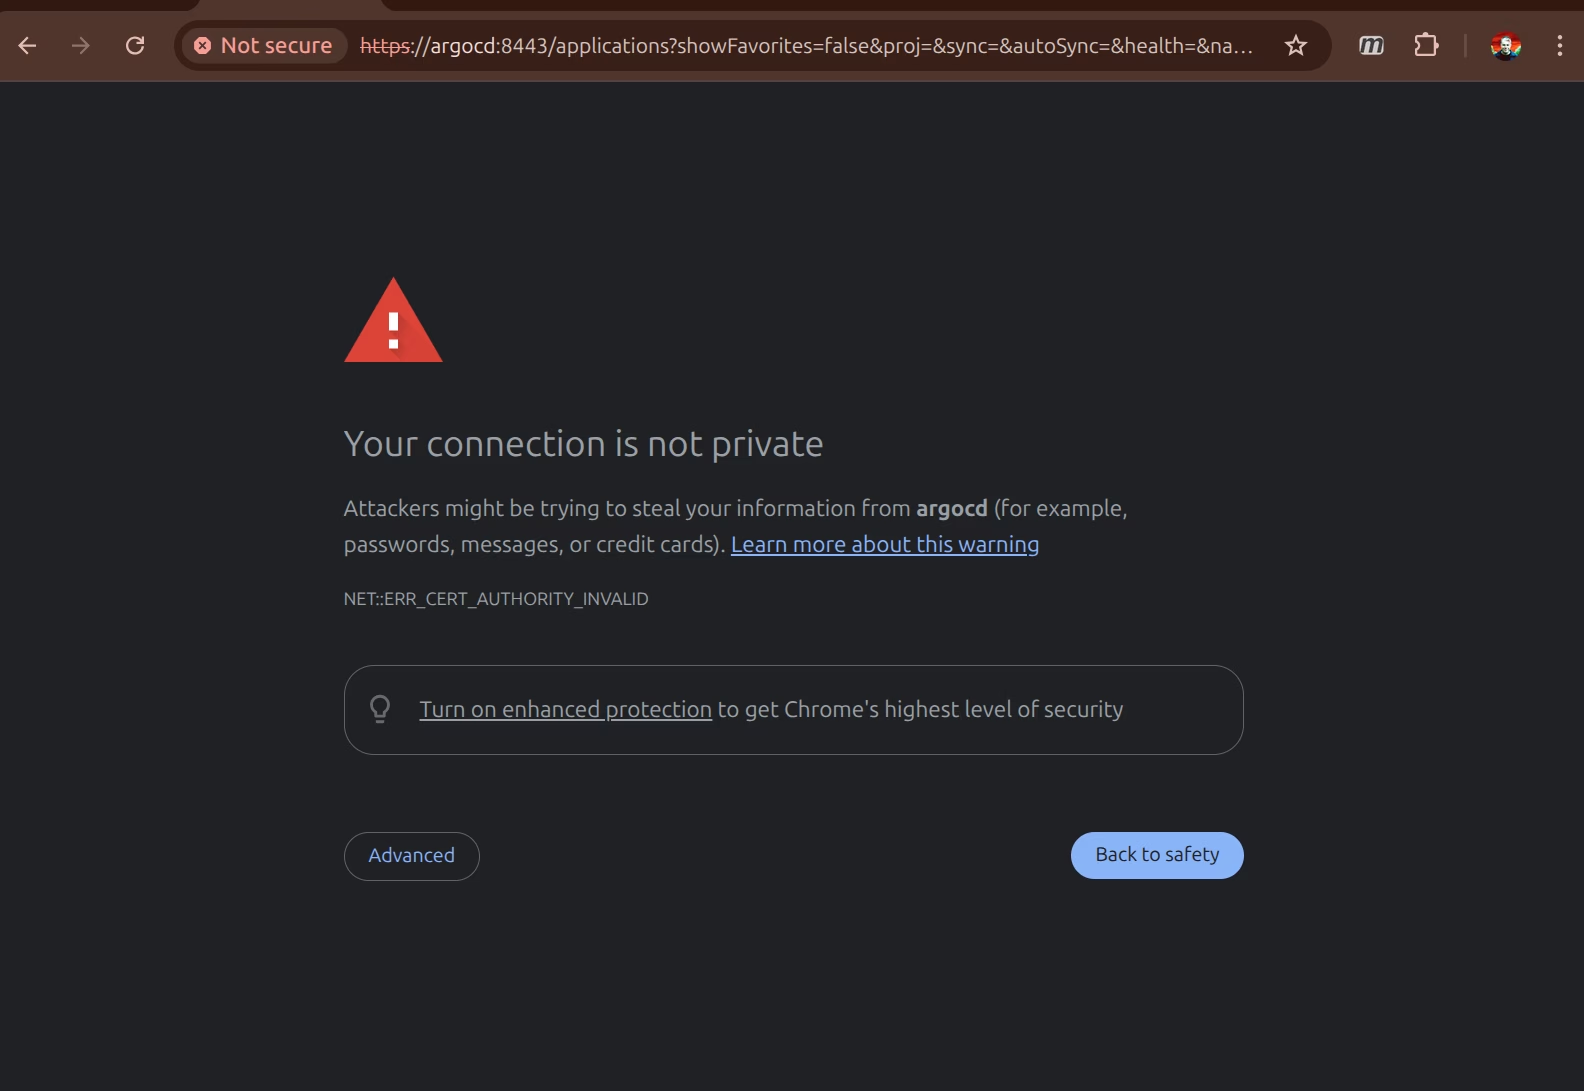
    My little kubernetes cluster has a few front-ends now, argocd, longhorn and the arkade servers. It’s getting a little tiresome having to OK certificate warnings like this:

    So I started reading up on cert-manager.

    I use letsencrypt and have some experience with setting that up. I’ve also got some experience setting up DNS challenges and auto-cert-renew, but I didn’t really want my little pi-cluster on (or near) the internet. I found this great article about setting up self-signed certs on cert-manager and basically followed it to add Certificates to all my IngressRoutes (thanks Remy).

    I’m building a little library of setup scripts for my kubernetes cluster (so far argocd and longhorn). When I roll the nodes, I run these scripts to set things up. The cert-manager.sh comes first (so that I can generate certs for the frontends of argocd and longhorn). That looks like this:

    sandy@bunsen:~/k3s$ cat cert-manager.sh 
    #!/bin/bash

    . ./functions.sh

    # Root CA is output as hobo-root-ca.crt - can be imported into chrome
    # or sudo cp hobo-root-ca.crt /usr/local/share/ca-certificates
    # sudo update-ca-certificates

    NAMESPACE=cert-manager

    helm install \
    cert-manager oci://quay.io/jetstack/charts/cert-manager \
    --version v1.18.2 \
    --namespace $NAMESPACE \
    --create-namespace \
    --set crds.enabled=true

    pod_wait $NAMESPACE

    kubectl apply -f hobo-root-ca.yaml
    sleep 5

    echo "Output root CA to hobo-root-ca.crt"
    kubectl get secret hobo-root-ca-secret -n $NAMESPACE -o jsonpath='{.data.tls\.crt}' | \
    base64 --decode | \
    openssl x509 -out hobo-root-ca.crt

    kubectl apply -f hobo-intermediate-ca1.yaml
    sleep 5
    # check the intermediate cert
    openssl verify -CAfile \
    <(kubectl -n $NAMESPACE get secret hobo-root-ca-secret -o jsonpath='{.data.tls\.crt}' | base64 --decode) \
    <(kubectl -n $NAMESPACE get secret hobo-intermediate-ca1-secret -o jsonpath='{.data.tls\.crt}' | base64 --decode)

    The script uses helm to install cert-manager in it’s own namespace and installs the root CA and intermediate CA ClusterIssuers objects:

    sandy@bunsen:~/k3s$ more hobo-root-ca.yaml 
    apiVersion: cert-manager.io/v1
    kind: ClusterIssuer
    metadata:
    name: hobo-root-ca-issuer-selfsigned
    spec:
    selfSigned: {}
    ---
    apiVersion: cert-manager.io/v1
    kind: Certificate
    metadata:
    name: hobo-root-ca
    namespace: cert-manager
    spec:
    isCA: true
    commonName: hobo-root-ca
    secretName: hobo-root-ca-secret
    duration: 87600h # 10y
    renewBefore: 78840h # 9y
    privateKey:
    algorithm: ECDSA
    size: 256
    issuerRef:
    name: hobo-root-ca-issuer-selfsigned
    kind: ClusterIssuer
    group: cert-manager.io
    ---
    apiVersion: cert-manager.io/v1
    kind: ClusterIssuer
    metadata:
    name: hobo-root-ca-issuer
    spec:
    ca:
    secretName: hobo-root-ca-secret

    sandy@bunsen:~/k3s$ more hobo-intermediate-ca1.yaml 
    apiVersion: cert-manager.io/v1
    kind: Certificate
    metadata:
    name: hobo-intermediate-ca1
    namespace: cert-manager
    spec:
    isCA: true
    commonName: hobo-intermediate-ca1
    secretName: hobo-intermediate-ca1-secret
    duration: 43800h # 5y
    renewBefore: 35040h # 4y
    privateKey:
    algorithm: ECDSA
    size: 256
    issuerRef:
    name: hobo-root-ca-issuer
    kind: ClusterIssuer
    group: cert-manager.io
    ---
    apiVersion: cert-manager.io/v1
    kind: ClusterIssuer
    metadata:
    name: hobo-intermediate-ca1-issuer
    spec:
    ca:
    secretName: hobo-intermediate-ca1-secret

    ClusterIssuers basically generate key-pairs and dump the key/crt pair into a kubernetes secret. The cert-manager.sh script dumps the .crt out of the root-ca secret into a file called hobo-root-ca.crt which can be installed in chrome (navigate to chrome://settings/ -> Privacy and Security -> Manage Certificates …). You can also import on linux in general with sudo cp hobo-root-ca.crt /usr/local/share/ca-certificates/; sudo update-ca-certificates

    Update The Game Helm Chart So My Services have Certificates

    With cert-manager installed and configured, I could upgrade the arcade helm chart. Briefly that looks like this:

    sandy@bunsen:~/arkade$ git diff 5cbd3f5e742a8a8f272cb4f1547faa51aa1a216d
    diff --git a/Makefile b/Makefile
    index fa0ea12..1db1dd6 100644
    --- a/Makefile
    +++ b/Makefile
    @@ -4,7 +4,7 @@ $(strip $(firstword $(foreach game,$(GAMES),$(findstring $(game),$(1)))))
    endef

    # Variables
    -CHART_VER := 0.1.5
    +CHART_VER := 0.1.6
    BUILD_IMAGE ?= mamebuilder
    TAG ?= latest
    SHELL := /bin/bash
    diff --git a/helm/game/templates/certificate.yaml b/helm/game/templates/certificate.yaml
    new file mode 100644
    index 0000000..e5cf300
    --- /dev/null
    +++ b/helm/game/templates/certificate.yaml
    @@ -0,0 +1,14 @@
    +{{- if .Values.certificate.enabled -}}
    +apiVersion: cert-manager.io/v1
    +kind: Certificate
    +metadata:
    + name: {{ include "game.fullname" . }}
    + namespace: games
    +spec:
    + secretName: {{ include "game.fullname" . }}-cert-secret # <=== Name of secret where the generated certificate will be stored.
    + dnsNames:
    + - "{{ include "game.fullname" . }}"
    + issuerRef:
    + name: hobo-intermediate-ca1-issuer
    + kind: ClusterIssuer
    +{{- end }}
    diff --git a/helm/game/templates/ingressroute.yaml b/helm/game/templates/ingressroute.yaml
    index 6838816..3b73b41 100644
    --- a/helm/game/templates/ingressroute.yaml
    +++ b/helm/game/templates/ingressroute.yaml
    @@ -3,6 +3,9 @@ apiVersion: traefik.io/v1alpha1
    kind: IngressRoute
    metadata:
    name: {{ include "game.fullname" . }}
    + annotations:
    + cert-manager.io/cluster-issuer: hobo-intermediate-ca1-issuer
    + cert-manager.io/common-name: {{ include "game.fullname" . }}
    spec:
    entryPoints:
    - websecure
    @@ -14,5 +17,5 @@ spec:
    - name: svc-{{ include "game.fullname" . }}
    port: 80
    tls:
    - certResolver: default
    + secretName: {{ include "game.fullname" . }}-cert-secret
    {{- end }}
    diff --git a/helm/game/values.yaml b/helm/game/values.yaml
    index 4ed05a1..278754c 100644
    --- a/helm/game/values.yaml
    +++ b/helm/game/values.yaml
    @@ -76,6 +76,9 @@ ingress:
    ingressroute:
    enabled: true

    +certificate:
    + enabled: true
    +
    resources: {}
    # We usually recommend not to specify default resources and to leave this as a conscious
    # choice for the user. This also increases chances charts run on environments with little

    I added the certificate template in my helm chart, and then added cert-manager annotations to the IngressRoute and changed the tls: definition.

    Push the helm chart change and sync the ArgoCD projects and voila!

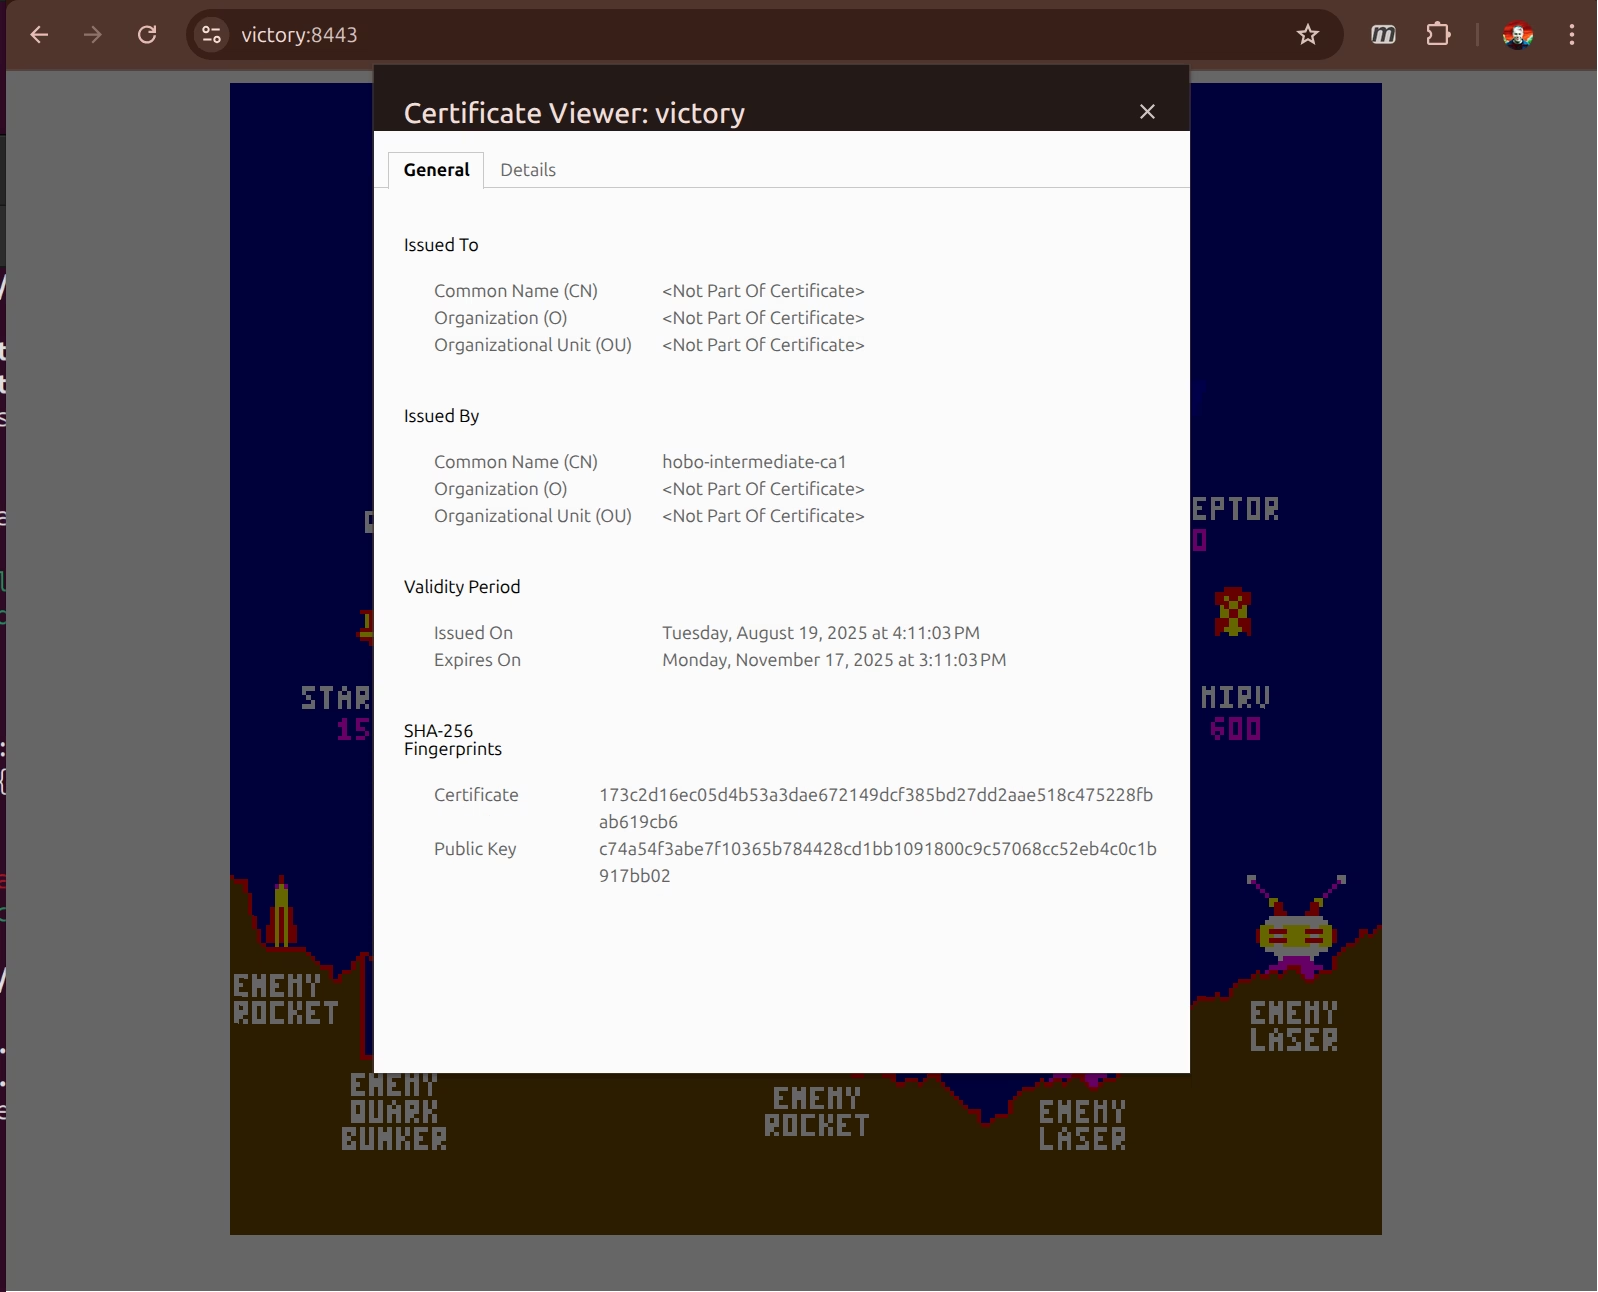
    I also updated the argocd and longhorn setups to add Certificates to their IngressRoute definitions – so now all the frontends in my cluster can be accessed without the security warning.

    -Sandy